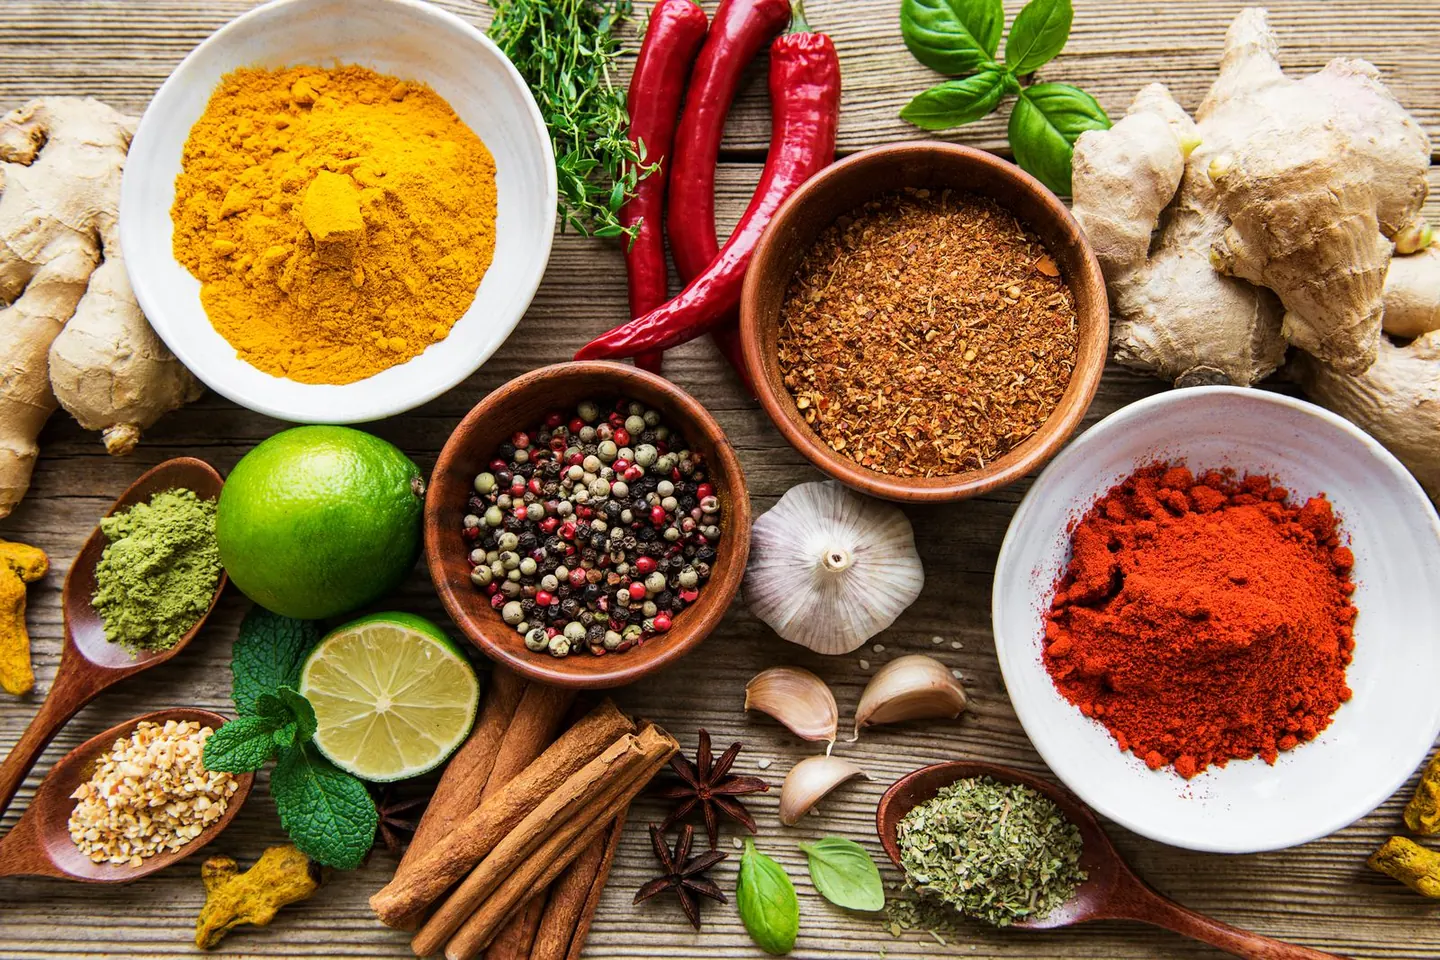
PART ONE — WHY YOUR PLATE CHANGED
Kerala did everything right. It educated its women, immunised its children, built health centres within walking distance of almost every village, and drove infant mortality down to figures that embarrass much richer places. Then, in the space of about two generations, it developed some of the worst metabolic numbers in India. Both of those things are true at once, and the second is not a judgement on the first.
The four chapters that follow establish four things, in order. What the numbers actually are, stated precisely, including the ones that are surprising. What changed in the food, and when, and through what documented mechanism — because the story is not that Kerala ate badly, but that what Kerala ate was replaced. Which numbers describe you, measured on cut-offs built for South Asian bodies rather than borrowed from elsewhere. And what is physically happening inside a South Asian body that makes all of this land harder than it should.
None of this is preamble to the recipes. It is the reason the recipes are shaped the way they are.
Chapter 1 — The Kerala Paradox
The corridor at seven in the morning
The queue for the fasting bloods forms before the lab opens. It is a corridor in any of a hundred hospitals in Kerala, and by ten past seven there are perhaps forty people in it, sitting on moulded plastic chairs bolted in rows, standing where the chairs have run out. Nobody has eaten since the night before. There is a particular quality to that hunger in a room full of people: talkative, slightly irritable, unified.
The forms in people's hands are almost identical. Fasting blood glucose. Glycated haemoglobin. Lipid profile. Liver function. A retired schoolteacher, sixty-one, who taught chemistry for thirty-four years and can tell you what glycated haemoglobin measures, has been told her sugar is "a little high" for four consecutive years. A man of forty-three in a pressed shirt is here because his younger brother in Dubai had a stent put in, and their father had one before that. A woman in her thirties has a form from a gynaecologist with the word insulin written on it in blue ink. They know what the tests are. Several of them could explain the pathophysiology.
This is the thing about Kerala that makes it different from anywhere else in India, and it is the thing that makes its metabolic situation genuinely hard to explain. This is not a population that lacks information. It is a population that has been tested, informed, screened and educated, at a level that most of the world's health systems would envy, and that has got sicker anyway.
The ledger, first half
Start with what Kerala achieved, because it is not a small thing and because the rest of the chapter makes no sense without it.
Life expectancy at birth in Kerala is 75 years, against 70 for India as a whole. Infant mortality is 6 deaths per 1,000 live births, against 28 nationally — a figure in the range of some high-income countries, achieved in a state whose per-capita income has never been remotely comparable. Literacy is 94.0%, against 73.0% for India (NITI Aayog, 2025). These are the numbers that made Kerala a case study in development economics for forty years, and they were not achieved by accident or by wealth. They were achieved through land reform, mass literacy campaigns, a dense network of primary health centres and a political culture that made public services a matter of electoral consequence.
Screening reach follows the same pattern. In a multistage random sample of 3,398 women and 2,982 men aged 30 and over across four Kerala districts, 90.3% of women and 80.8% of men had had their blood pressure tested in the previous year; 86.2% and 78.3% respectively had had their blood glucose tested (Negi et al., 2022). Being tested is not Kerala's problem.
The ledger, second half
Now the other column, and the best source for it is a community-based survey of 12,012 adults aged 18 to 69, sampled across all 14 districts in 2016 and 2017 using WHO STEPS methodology (Sarma et al., 2019).
Abdominal obesity in 72.6% of women (95% CI 70.7–74.5) and 39.1% of men (36.6–41.7). Raised blood pressure in 30.4% (29.1–31.7), higher in men at 34.6% than in women at 28.0%. Raised fasting blood glucose in 19.2% (18.1–20.3). Estimated daily salt intake of 6.7 g. Current alcohol use in 28.9% of men (26.5–31.4).
Read the first of those figures again. Nearly three in four adult women in Kerala meet the criterion for abdominal obesity. Not overweight in the general sense, and not a figure inflated by an unusual cut-off: this is measured waist circumference against a threshold, in a properly sampled survey covering every district in the state.
And then the number that should reframe everything: only 12.4% of people with hypertension, and 15.3% of people with diabetes, had it controlled. Roughly one in eight and one in seven. In the state with the best health indicators in India, in a population that gets screened, the treatment cascade leaks at the last and most important step.
What "controlled" actually means, and why the leak matters
A control cascade has four stages: the condition exists, it is detected, it is treated, and the treatment works well enough to bring the numbers into range. Kerala performs well at stage two — its ratio of known to newly diagnosed diabetes is favourable, which means detection is comparatively good. It fails at stage four. The consequence is that a large population is carrying diagnosed, treated, uncontrolled disease, which is a very different clinical situation from undiagnosed disease and requires a very different response. Detection campaigns do not fix it. Neither, as this chapter will show, does education.
One more figure from the same survey, and it is the one I find hardest to read: only 13.8% of urban and 18.4% of rural residents had none of the seven non-communicable disease risk factors studied. Which is to say that in Kerala, carrying no metabolic risk factor at all has become the minority condition.
The rural finding, which deserves its own paragraph
In most of India, and in most of the world, the metabolic transition arrives in cities first. Urban populations are more sedentary, eat more processed food, and show higher rates of diabetes, hypertension and obesity than rural populations in the same state. The national picture bears this out: in the ICMR-INDIAB survey of 113,043 adults across 31 states and union territories, every condition except prediabetes was more frequent in urban than in rural areas (Anjana et al., 2023).
Kerala does not behave this way. The state survey's own words are unambiguous: "There was no rural–urban difference in terms of raised BP or raised FBG prevalence in Kerala" (Sarma et al., 2019). Abdominal obesity was somewhat higher in towns, at 67.4% against 58.6%, but blood pressure and fasting glucose had levelled entirely.
The coronary artery disease data say the same thing from a different direction. A community cross-sectional study of 5,167 adults, mean age 51, found age-adjusted definite coronary artery disease in 3.5% — 4.8% of men and 2.6% of women — with any coronary artery disease in 12.5%, and no urban–rural difference in definite disease (Krishnan et al., 2016).
This matters more than it first appears. If rural Kerala were merely lagging behind urban Kerala, the state would have a time problem: the villages would be ten or fifteen years behind and the intervention would be to reach them before they arrived. Instead the whole state has arrived together. Whatever changed, changed everywhere, at roughly the same time, and it reached the interior as completely as the coast. That is not a description of urbanisation. It is a description of a change in the food supply and in daily physical work that did not respect the rural boundary at all — which is exactly what Chapter 2 documents.
The trend, and the trajectory
The same coronary study contains the trend line, and it is stark. The 1993 comparator, from a survey of the rural population of Thiruvananthapuram district, found definite coronary heart disease in 14 per 1,000 adults, or 1.4% (Kutty et al., 1993). By 2016 the age-adjusted figure was 3.5%. The authors state it plainly: "The prevalence of definite CAD in Kerala increased nearly three times since 1993" (Krishnan et al., 2016).
Twenty-three years. A near-tripling. Within one working lifetime, and within the memory of anyone reading this who is over forty.
The risk-factor profile in that same coronary study reads like a summary of the whole problem: overweight or obese 59%, abdominal obesity 57%, hypertension 28%, diabetes 15%, high total cholesterol 52%, low HDL cholesterol 39%, and current smoking in 28% of men.
The direction of travel
The most recent round of the National Family Health Survey suggests the movement has not stopped. Kerala women with a BMI of 25 or above are reported at 46.7%, the highest of any Indian state, up from 38.2% in the preceding round roughly four years earlier — a rise of about 8.5 percentage points. Kerala men are reported at around 37%. High blood sugar is reported in 31.9% of Kerala men, the highest in India, and 28.9% of women, up from 27% and 24.8%. Nationally, the same survey reports women with a BMI of 25 or above at 30.7%, up from 24.0%, and men at 27.3%, up from 22.9%.
There is a definitional trap in those numbers that is worth flagging, because press coverage falls into it constantly. The survey reports BMI of 25 or above as "overweight or obese" for adults aged 15 to 49, and headlines routinely relabel this as obesity. Under the Asian Indian cut-offs set out in Chapter 3, a BMI of 25 is already Grade II obesity, and Grade I begins at 23.0. Which means that if anything the survey figure understates the at-risk fraction of this population, because everyone between 23.0 and 24.9 is counted as normal in it and is not.
One further group deserves naming here, because a great many readers of this book belong to it or are related to someone who does. Kerala's return migrants, tracked through the Kerala Migration Survey, come home at a mean age of 51, mostly on retirement or ill health; 55% report poor self-rated health, and 70% of those have at least one chronic disease, with elevated smoking and alcohol use and less access to health schemes than non-migrants (Paul et al., 2023). Twenty years of Gulf work, and then the bill.
The national frame
Kerala is not an outlier in kind, only in degree and in pattern. The ICMR-INDIAB study — 113,043 adults, 31 states and union territories, surveyed between October 2008 and December 2020 — gives the weighted national prevalences that every Indian metabolic discussion should be anchored to (Anjana et al., 2023):
| Condition | Weighted national prevalence (95% CI) |
|---|---|
| Diabetes | 11.4% (10.2–12.5) |
| Prediabetes | 15.3% (13.9–16.6) |
| Hypertension | 35.5% (33.8–37.3) |
| Generalised obesity | 28.6% (26.9–30.3) |
| Abdominal obesity | 39.5% (37.7–41.4) |
| Dyslipidaemia | 81.2% (77.9–84.5) |
Dyslipidaemia in four out of five adults. Hypertension in more than one in three. Prediabetes exceeding diabetes, which means the wave has not finished arriving. The authors' own summary is that prevalence "is considerably higher than previously estimated", and that while the epidemic appears to be stabilising in the more developed states, it is still increasing in most others.
Kerala's figures sit above these national ones on almost every axis. It got there first, which in this particular race is not an advantage.
The two trials that should have worked
Here is where this chapter has to do something that health books generally avoid, which is to describe two well-designed studies that produced almost nothing, and to take the result seriously rather than explaining it away.
The Kerala Diabetes Prevention Program was a cluster-randomised controlled trial of 1,007 adults aged 30 to 60, in 60 polling-area clusters in Neyyattinkara taluk, Thiruvananthapuram district. Participants were at elevated risk by the Indian Diabetes Risk Score but had a negative glucose tolerance test at baseline. The intervention was a 12-month peer-support programme: 15 group sessions, 12 of them led by trained lay peer leaders drawn from the community itself, plus community-level activities. Controls received an education booklet. Follow-up reached 95.7% at 24 months. Cost was US$22.50 per participant for the year (Thankappan et al., 2018).
It was, by any reasonable standard, a good intervention: culturally embedded, locally delivered, cheap enough to scale, and rigorously evaluated. And at 24 months, diabetes had developed in 14.9% of the intervention arm against 17.1% of controls, a relative risk of 0.88 with a confidence interval of 0.66 to 1.16 and a P value of 0.36. The primary endpoint was not met.
The programme did move things. The Indian Diabetes Risk Score fell by 1.50 points (P=0.022). Alcohol use fell (RR 0.77, P=0.018). The proportion eating five or more servings of fruit and vegetables a day rose substantially (RR 1.83, P=0.008). Physical functioning improved. And a nine-year follow-up, retaining 86% of the original cohort, found cumulative diabetes incidence of 30% in the intervention arm against 34% in controls — again not significant on the primary definition (RR 0.88, 0.73–1.08, P=0.24), though by fasting-plasma-glucose criteria alone incidence was 28% lower in the intervention arm (RR 0.72, 0.53–0.98, P=0.036) (Jeemon et al., 2026). The scale-up, which trained about 15,000 peer leaders across three districts and reached an estimated 375,000 adults, recorded real changes in a sampled subset: tobacco use in men from 30% to 25%, alcohol use from 40% to 32%, and mean waist circumference from 89.5 cm to 87.5 cm (Ravindranath et al., 2020).
Now cross the ocean. SAHELI was a single-blind randomised trial of 549 South Asian adults aged 18 to 65 in the Chicago metropolitan area, all overweight or obese with at least one additional cardiovascular risk factor. The intervention was a 16-week culturally adapted group lifestyle programme, led by community health coaches, delivered in English, Gujarati, Hindi and Urdu, with optional maintenance sessions. Controls received monthly written health education (Kandula et al., 2024).
At 12 months, the between-group differences were: weight, −0.07 kg (95% CI −0.55 to 0.42). Systolic blood pressure, +0.47 mmHg. Diastolic, +0.44 mmHg. Total cholesterol, −2.47 mg/dL. HbA1c, −0.07%. Every one of them null. And, exactly as in Kerala, the intervention participants did show greater improvements in dietary quality, in physical activity, and in self-efficacy.
The finding both trials share, and what it costs us to admit it
Two rigorous, culturally competent, group-delivered, education-forward lifestyle programmes, in two South Asian populations on two continents, both improved what participants knew and reported doing about food. Neither moved weight, blood pressure, lipids or HbA1c to a statistically meaningful degree. The honest reading is not that lifestyle change does not work — DiRECT, ReTUNE, the Diabetes Prevention Program and the Indian Diabetes Prevention Programme all show that it does, and Chapter 6 sets out their numbers. The honest reading is narrower and more useful: knowing about food, in the right language, in your own community, is not by itself enough to change a body. What has moved hard endpoints in this population is a large, structured, sustained change in what is actually eaten.
What this book is therefore not going to do
It is not going to try to educate you into health. You are, statistically, already educated. If you are reading a 300-page book about Kerala food and metabolic evidence, you are not the person who needs to be told that fried snacks are energy-dense or that sugar in tea is sugar.
What K-DPP and SAHELI failed to shift is the gap between what people know and what is physically on the plate at eight o'clock on a Wednesday evening. That gap is not an information gap. It is a gap in defaults: in what is already cooked, what is in the fridge, what the household expects, how much rice goes into the vessel, how much oil goes into the pan, whether there is a pulse in the meal, whether there is a vegetable in any quantity that matters.
So this book operates at the level of the default. It changes the composition of the dish, the weight of the portion, the measure of the oil, the presence of the pulse, and the proportion of the plate given over to vegetables — inside recipes that taste like the food you already want to eat. That is the whole strategy, and the two null trials above are the reason for it.
The thesis
Which brings us to the sentence the rest of Part One exists to defend.
The traditional Kerala plate is not the culprit.
Matta rice, parboiled and unpolished, in a quantity bounded by a leaf. A great deal of vegetable and green matter, cut fine, barely cooked, dressed with grated coconut. Fish more often than red meat, because the sea and the backwaters were closer than the butcher. A pulse, routinely, because pulses were cheap and grew locally. Buttermilk to finish. A fermented or steamed rice breakfast with a legume or an egg beside it. Coconut oil in teaspoons, because it was pressed by hand and cost something. Six tastes in one meal, because the tradition explicitly asked for six tastes. Sourness from a fruit rather than richness from a sauce.
By any modern measure of dietary quality — energy density, fibre, protein adequacy, vegetable volume, degree of processing — that is a good way to eat. It is not a coincidence that it looks, when you set it out on paper, like the dietary patterns that perform well in trials.
Something displaced it. Something replaced home-parboiled red rice with imported polished white rice, replaced the fermented breakfast with refined-flour bread, replaced teaspoons of oil with a poured glug, replaced the pulse with nothing, tripled the portion, and inserted two or three daily occasions of sweet tea with a fried item beside it. That displacement is documented, it is dated, and it has mechanisms.
That is the next chapter.
Chapter 2 — What We Lost, and When
Five hundred and fifty tonnes of pepper
In the middle of the second century of the common era, a merchant ship called the Hermapollon sailed from the Malabar coast to Egypt. We know its name, and we know roughly what was in its hold, because the settlement document for the maritime loan that financed the voyage survives: a Greek papyrus of about 38 by 27 cm, catalogued as P. Vindob. G 40822, negotiated in Alexandria, now in the Austrian National Library in Vienna. Federico De Romanis's reconstruction of the cargo, in The Indo-Roman Pepper Trade and the Muziris Papyrus (2020), puts it at roughly 635 tonnes in total, of which about 552 tonnes was pepper, alongside Gangetic spikenard, ivory, tortoise shell and malabathron. Roman customs on Indian goods was the tetarte — a flat 25%.
One ship. Five hundred and fifty tonnes of Kerala pepper, in a single hull, a tonnage comparable to Portuguese Indiamen fifteen centuries later.
The port it sailed from was Muziris, near the mouth of the Periyar, which Pliny the Elder called primum emporium Indiae, the first emporium of India, while also noting that it was not an ideal landing place on account of pirates. The Periplus of the Erythraean Sea, an anonymous Greek merchant's handbook of the first century, describes it as a place that "abounds in ships sent there with cargoes from Arabia, and by the Greeks", and notes pepper as coming from only one region. Seven seasons of excavation between 2007 and 2014 by the Kerala Council for Historical Research, at Pattanam near North Paravur in Ernakulam district, turned up Roman pottery, glass and coins spanning roughly 100 BCE to 400 CE, a fired-brick wharf with nine teak bollards, a 6-metre canoe of Artocarpus hirsutus, and Tamil-Brahmi inscriptions of about the second century CE. The identification of Pattanam as Muziris is an inference from material culture rather than from any inscription that names the place, so the correct formulation is the cautious one: the Pattanam site, widely identified with Muziris.
Pliny complained about the cost of all this. His famous figure has India draining the Roman empire of at least 50 million sesterces a year, and it is genuinely in the Natural History, written around 77 CE. It should be quoted as what it is — a Roman moralist's complaint about a trade deficit, not an audited account. For scale, a legionary's annual pay in this period was on the order of 900 sesterces.
What that wealth reveals about the plate
Hold the tonnage in your mind and then ask what the people who grew, picked, dried and carried that pepper were eating. The answer is the point of this section.
They were eating rice, where rice could be grown in the engineered wet pockets — the valley-bottom elas, the below-sea-level polders of Kuttanad, the saline-tolerant pokkali of the coastal belt, which grows to 2 metres so that it can survive flooding and is farmed in rotation with prawns, the prawns eating the stubble and their waste fertilising the next crop. They were eating an extraordinary quantity of vegetable and green matter, because Kerala's laterite midlands are poor for wheat and temperate vegetables but excellent for tree crops, so a great deal of what a Malayali eats grows above head height: coconut, jackfruit, mango, cashew, pepper on a support tree. They were eating fish, because nowhere in a state 35 to 120 km wide and 580 km long is far from either the sea or the mountains. They were eating tubers, greens, pulses and buttermilk. They were souring their food with fruit — kudampuli, tamarind, raw mango, lime — because two monsoons and a temperature band of 23 to 32 °C year-round mean there is no dormant season, no winter, and therefore no need for the large dried-grain-and-preserve culture that developed in colder places.
That plate needed almost nothing from outside. The wealth of the pepper trade flowed out through Muziris and Kozhikode and Kochi for two thousand years, and the food stayed local, seasonal and cheap. The Namboothiri household calendar, as recorded by the community itself, divides the year not by month but by what the land is giving: plantain and yam for three months, jackfruit and mango for another three, leafy vegetables for a quarter of the year. That is a menu written by rainfall.
Everything that follows in this chapter is the story of how a plate that needed nothing came to depend on imports.
The arrivals
Kerala's kitchen has been rearranged by strangers for as long as there have been strangers, and most of those rearrangements were additions rather than substitutions.
Arab traders from Yemen, Oman, Hadhramaut and Dhofar were the continuous presence between Rome and Portugal. Ibn Battuta, in 1342, called Calicut one of the chief ports, with the largest port in the world. Arab men formed unions with local women within Kerala's matrilineal framework, and the Mappila community that resulted is today roughly a fifth of Kerala's population. What that contact brought to the food was wheat tolerance in the north, dried fruit, a dense snack repertoire, and a bread culture — pathiri, of which about 40 varieties are documented in Malabar alone. The community's own founding story, the conversion of the Chera ruler Cheraman Perumal to Islam and his voyage to Arabia, is not established history; the story goes that he sailed, and the story matters enormously to North Malabar identity, and both of those statements should be made together.
Zheng He's seven treasure voyages between 1405 and 1433 made Kochi a regular stop, and pepper was the cargo they wanted; that much is in the Ming record. The cantilevered cheenavala, the twenty-metre "Chinese fishing nets" of Fort Kochi, are popularly attributed to those voyages, including by tourism agencies, but no document supports it. The cheena chatti, Kerala's deep cast-iron pan, carries the same cheena prefix. The honest formulation is that Kerala's frying pan is named for China and nobody can prove why.
Then, on 18 May 1498, Vasco da Gama made landfall at Kappad near Kozhikode, anchored at Pantharini-Kollam on 27 May, and was received by the Zamorin of Calicut on 28 May. His stated errand was Christians and spices. His gifts to the court were judged contemptible, and the Roteiro lists them: twelve pieces of cotton cloth, four scarlet hoods, six hats, four strings of coral, a case with six wash-hand basins, a case of sugar, two casks of oil and two of honey. The man who opened the sea route to the pepper coast arrived with six hats.
What the Portuguese did bring, over the following century, changed Indian food more than any political event. The mechanism was the Atlantic circuit: American crops to Lisbon, then to West Africa and Brazil, then east to Goa and the Malabar and Konkan coasts, spreading inland from the ports. K. T. Achaya's summary is the standard one: it was with the entry of the Portuguese that a floodgate of new vegetables entered Indian land and kitchens — potato, tomato, tapioca, groundnut, maize, papaya, pineapple, guava, avocado, rajma, cashew, sapota, and capsicum and chilli in all its forms.
Chilli was the most consequential. Kerala already had pepper, long pepper and ginger for heat; chilli displaced none of them, and reorganised everything around itself. Cashew was taken to Goa between 1560 and 1565, planted initially to bind soil on laterite slopes, and Kollam became India's cashew-processing capital. Tomato and potato arrived early and were taken up slowly, which gives the working cook a useful dating tool: tomato is essentially absent from classical sadya and from kudampuli fish curry, so its presence in a "traditional" Kerala recipe is a reliable sign of a recent recipe. Breadfruit's Malayalam name, seema chakka, records its status, seema meaning foreign, in pointed contrast to true jackfruit, chakka, indigenous to the Western Ghats and ancient. The occasional claim that the Portuguese introduced jackfruit is almost certainly wrong; what they did was spread it outward.
One corrective belongs here, because it is the most common error in English-language Kerala food writing. The reflex that anything steamed, fermented or coconut-based in Kerala must be a colonial import is simply false, and Ammini Ramachandran disposes of it neatly: the Portuguese and Dutch had neither coconut nor bamboo in their own kitchens. Appam, idiyappam and puttu are pre-colonial South Indian foods. Sangam-era Tamil literature, of roughly 300 BCE to 300 CE, has vendors selling appam and idiyappam on the seashore, and one verse describes delicate appams like honeycombs, which remains the best description of a good appam's lacy edge and spongy centre ever written. Steam-cooking, svinna bhakshya, is described in Varahamihira's Brihat Samhita in the early sixth century. The sevanazhi, the press that extrudes idiyappam, is documented along with the noodles it makes in the Kannada Lokopakara of 1025 CE. A Kerala cook using one today is using a thousand-year-old documented tool.
The tapioca story, which is the finest example in the book
Of everything that arrived, cassava is the one that became identity. Kappa. Maracheeni. Poola. Kolli. Chini. The sheer number of Malayalam names is itself the clue: it arrived more than once, in more than one place, under more than one patron.
The arrival is genuinely contested. One account has Portuguese ships bringing it from Brazil to the Malabar coast in the sixteenth or seventeenth century; Achaya's list of Portuguese introductions includes tapioca. Another, which Kerala Tourism itself gives, credits the reign of Ayilyam Thirunal Rama Varma (1860–1880), with roots imported from Brazil on the advice of his brother, the botanist and later Maharaja Vishakham Thirunal Rama Varma (1880–1885). The resolution that is almost certainly correct is that the plant arrived earlier and remained marginal, and that what the Travancore royals did in the 1860s to 1880s was systematically promote it as a famine crop. Vishakham Thirunal is credited with selecting varieties that could be grown in any backyard and left in the ground until required, and with personally demonstrating both cultivation and preparation. A botanist prince working as an agricultural extension officer.
The story goes that he planted cassava near the palace in Trivandrum, and that once word spread that the root was edible, citizens harvested his demonstration plots by night. Tell it as a story; no record establishes it. The folk etymology that gives kappa from kappal, ship — the food that came off the boats — is widely repeated and linguistically plausible, and no primary source supports it.
What is documented is the arc from famine crop to staple, and it runs through official paper.
The Great Famine of 1876–78 is the backdrop to the promotion drive. By 1906, V. Nagam Aiya, Dewan of Travancore, recorded tapioca in the Travancore State Manual as having become "the poor man's food par excellence", which is the earliest crisp documentary statement of kappa's social position. By 1918 Travancore held a standing order for 20,000 tonnes of tapioca annually for the United States, which is a useful corrective to any romanticism: this peasant food was an export commodity within a generation of being promoted.
Then the Second World War, which is the hinge. The Japanese occupation of Burma cut off the rice imports on which Travancore and Cochin depended, and Kerala turned to tapioca on a mass scale. The archival trail is specific:
- 25 October 1942 — export of tapioca prohibited except by permit of the Excise Commissioner.
- 2 November 1943 — the Tapioca Control Order regulated purchase, sale and storage, and even transport in private vehicles.
- 1944 — legislative debate over whether the controls were harming the cultivators they were meant to protect.
- 1945 — the Famine Inquiry Commission warned that tapioca's low protein content meant it had to be supplemented, and explicitly recommended fish.
Sit with that last item for a moment. Kappa and meen curry — mashed tapioca against a fierce, sour fish curry, the most beloved everyday pairing in Kerala home cooking, the thing Malayalis abroad describe missing before they mention anything else — is in the most literal sense a nutritional prescription issued by a colonial famine commission in 1945. Starch that keeps you alive; fish that supplies what the starch does not. Love followed necessity, and then buried it so completely that the pairing now feels ancestral.
It is also, as it happens, correct nutrition. A high-glycaemic tuber eaten with a substantial protein and a large volume of sour, low-energy-density gravy is a well-built meal. Kerala arrived at the right answer under duress and kept it for the taste.
What the tapioca story teaches about every other tradition in this book
The pairings a cuisine treats as timeless are frequently recent, and frequently the residue of a constraint: a shortage, a policy, a price, an import ban. That is not a reason to hold them more lightly. It is a reason to notice that a plate can be redesigned, deliberately and well, and become beloved inside a single generation — because that is precisely what happened in 1945, and it is what this book is asking you to do again.
Rupture one: the land, and the paddy
Kerala's diet changed more between 1950 and 2000 than in the preceding five hundred years. Four forces did most of it, and the first was legal.
The Kerala Agrarian Relations Bill was introduced in 1957 by K. R. Gouri Amma in the first elected communist ministry: fixity of tenure, fair rent, a ceiling on holdings. The Kerala Land Reforms Act of 1963 built the machinery. The decisive instrument was the Amendment Act of 1969, which ended landlordism, transferred ownership to cultivating tenants, and granted homestead ownership to kudikidappukar, hutment dwellers, of three to ten cents each. Ceilings held families to roughly 12 to 15 acres depending on land quality.
The consequences for the table cut both ways, and both halves matter.
On the credit side, an entire class of agricultural labourers acquired a house plot, and in Kerala's climate a house plot is a food system. The backyard — a coconut palm or two, a jackfruit tree, a mango, tapioca, a pepper vine, curry leaf, a few plantains, a drumstick tree, koorka and yam in the corner — became a near-universal feature of Kerala domestic life. The kitchen-garden character of Kerala cooking, which every book about this food praises, is in its universality a post-1969 phenomenon. Land reform did not just redistribute land; it distributed a produce supply.
On the debit side, holdings fragmented into parcels too small for commercial paddy, and smallholders lacked the capital for high-yield rice. Rice acreage collapsed and never recovered. Land moved to rubber, coconut, arecanut and banana, and later, as remittance income made cultivation optional, to nothing at all. Kerala became structurally dependent on rice imported from Andhra Pradesh and Tamil Nadu.
The state that fought hardest for the land stopped growing its own staple.
Rupture two: red rice to white
The imported rice was not the rice Kerala had been eating, and this is the most consequential single substitution in the modern Malayali diet.
Kerala's own rice is matta — rosematta, Palakkadan matta, now GI-registered — and it is parboiled: steeped, steamed and dried in the husk before milling. The process drives the bran's nutrients and pigment inward, hardens the grain, and leaves it yellowish-pink with reddish outer layers that hold their colour and their earthy flavour through cooking. Traditionally this was done at home, in the yard, in quantity. What arrived from Andhra Pradesh and Tamil Nadu was polished white rice.
Two measured consequences. First, thiamine: in the ICMR-NIN Indian Food Composition Tables, parboiled milled rice carries 0.17 mg of thiamine per 100 g against 0.05 mg in raw milled rice, roughly three and a half times as much, because parboiling drives the water-soluble B vitamins from the bran into the endosperm before the bran is removed. This is why beriberi historically tracked polished non-parboiled rice, and it is a hard, citable, Kerala-relevant fact.
Second, and more important for this book, glycaemic response. In a study of an Indian parboiled Indica variety, glycaemic index rose from 57.6 for the brown grain to 73 at 2.3% polish and 79.6 at 9.7% polish, with 24-hour glycaemic responses of 34.7, 55.5 and 58.4 respectively (Shobana et al., 2017). The authors' conclusion is that any degree of polishing leads to higher glycaemic responses. Even minimal polishing wiped out most of the advantage.
So the staple of a population already carrying unusual metabolic risk was replaced with a version of itself carrying a substantially higher glycaemic load and a fraction of the thiamine, for reasons of supply, price, cooking time and the mid-century prestige of white rice as a modern food. Nobody decided this. It simply happened, everywhere, including in the villages — which is one reason the rural and urban numbers in Chapter 1 converged.
There is a closing irony worth a sidebar. Matta has been partially rehabilitated since the 2000s as a heritage and health food, and it is now often more expensive than white rice in Kerala shops. The grain that was displaced for being cheap and coarse is now sold at a premium for being neither.
Rupture three: Gulf money, oil and portions
Large-scale emigration to the Gulf states began in the early 1970s with the oil boom and accelerated through the 1980s and 1990s. Kerala's migration and remittance economy has been tracked since 1998 by the Kerala Migration Surveys of the Centre for Development Studies, Thiruvananthapuram, and any specific figure should come from there rather than from secondary reporting.
What the money did to the food is documentable qualitatively, and the mechanisms are clear.
Ingredients arrived in quantity. Dates, dried fruit and nuts. Wheat flour and maida. Evaporated and condensed milk. Commercial ghee and vanaspati. Arabic breads, mayonnaise, and a commercial shawarma culture.
Scale and fat rose. Remittance income raised protein consumption sharply, normalised meat at everyday meals rather than at feasts, and pushed both portion size and oil quantity upward. The vanaspati in commercially made Thalassery biryani is an artefact of this era and not of the dish's tradition, which is worth knowing before you assume the traditional version was always that rich.
Restaurants multiplied. Returning workers, and particularly those displaced by Saudi Arabia's Nitaqat localisation policy from 2011, opened roadside eateries selling the food they had cooked and eaten abroad. Kuzhi manthi and al faham across Malabar are the direct result: genuinely new dishes in Kerala, dating from the 1990s and 2000s, now so thoroughly naturalised that they read as ancient. The transmission runs both ways, and Thalassery iftar dishes are now cooked in Gulf cities.
And the wedding inflated. Gulf money enlarged the Malabar wedding feast enormously, and biryani displaced older wedding dishes in part for an unsentimental reason: it is easier to cook for 500 people than the alternatives.
None of this was decline. It was, for hundreds of thousands of families, the first real prosperity they had ever had, and it bought houses, education and medical care. But prosperity expressed through food, in a population with the physiology described in Chapter 4, has a cost, and the cost shows up in the survey data thirty years later.
Rupture four: maida parotta, the thattukada, and the packet
The Kerala parotta is a twentieth-century food made from an imported material. It is built from maida, refined wheat flour, which only became widely available in South India in the later twentieth century; the dough is worked, oiled, coiled and slapped into flaky layers, then griddled.
Its origins are contested in an instructive way. The culinary anthropologist Kurush Dalal argues that the layering technique is foreign to India and that the Malabar parotta most likely came with Arab and Central Asian traders from West Asia, noting that wheat is not grown in Kerala. The competing view is diffusion from the Punjabi and North Indian paratha. The oldest parotta stalls in Madurai date to around the 1950s. It rose during rice shortages as a cheap filler and then became a prized street food. Kothu parotta, the shredded griddle-tossed version, originated in Sri Lanka, spread to Madurai, and reached Kerala from there. The accurate formulation is therefore that the Kerala parotta is a Malabar–Tamil–Sri Lankan bread of West Asian technical ancestry, made from North Indian wheat, that became a Kerala icon within living memory.
Its inseparable partner is beef fry, beef ularthiyathu, and parotta-with-beef is both the most politically loaded plate in the state and, nutritionally, a large quantity of refined carbohydrate beside a large quantity of saturated fat.
The distribution network is the thattukada, literally the tray shop: the roadside night stall, typically opening at dusk, selling parotta, beef, omelette, kappa, fish, dosa and tea. It is one of three distinct public eating institutions in Kerala, each with its own cuisine and its own hour — the chayakkada, the tea shop, with its glass case of pathiri, unnakkaya, pazham pori and bonda, which is the older institution and the true public sphere of twentieth-century Kerala; the shaap, the toddy shop, fierce fish and meat in the afternoon; and the thattukada at night. Kerala's snack repertoire is the most developed in India, and the tea shop is the reason.
The tea shop is also where the arithmetic hides. Two to four daily occasions of sweet tea with a fried or sweetened item beside it carry very high energy density, liquid sugar and low satiety, and — critically — they hold no meal status in the eater's own mental accounting. Nobody counts a four o'clock parippu vada as a meal. The body does.
Then the packet. Industrially produced, ready-to-eat food arrived in Kerala as it arrived everywhere, and its effect on intake has been measured under controlled conditions in a way that very little in nutrition has been. In an inpatient randomised crossover trial, 20 weight-stable adults ate either an ultra-processed or an unprocessed diet for two weeks each, in either order, with the meals matched for presented calories, energy density, macronutrients, sugar, sodium and fibre, eaten freely. On the ultra-processed diet, energy intake was 508 ± 106 kcal a day higher (P=0.0001), and participants gained 0.9 ± 0.3 kg; on the unprocessed diet they lost 0.9 ± 0.3 kg (Hall et al., 2019).
Matched macronutrients. Matched fibre. Matched sodium. Matched energy density. Five hundred kilocalories a day of difference, from processing alone. That single finding is the strongest argument anyone has ever made for cooking from scratch, and it is the reason this book is a cookbook rather than a set of rules.
The breakfast, which is where the loss is most visible
The traditional Kerala breakfast is a steamed or fermented rice preparation with a protein beside it: puttu with kadala curry; appam with ishtu; idiyappam with egg curry or coconut milk; dosa with chammanthi; kanji with cherupayar; pathiri with a meat curry. Fermented or steamed whole-grain carbohydrate, a legume or an animal protein, very little added fat, no added sugar. Designed by nobody, and close to ideal.
What has displaced it is parotta, commercial bread, packaged cereal, sweetened tea and coffee, bakery items, and — for a great many working urban people — nothing at all. Puttu survives best because a puttu kutti is fast. Appam is retreating fastest, because its batter has to be started the night before.
That last observation contains the book's most useful single practical intervention, and it is a matter of framing rather than of nutrition. The fermented Kerala breakfast is not slow food. It is food that works while you sleep. Twelve minutes of attention at nine in the evening produces breakfast for two days. Part Two teaches the overnight batter as a routine rather than as a project, because that is the difference between a tradition you admire and a tradition you eat.
What the plate looked like, precisely, before all of this
Part Three has to restore something, so it is worth stating exactly what is being restored. Not a mood, and not a century — a specification.
The grain, parboiled and unpolished: matta, rosematta, or the older local varieties, bounded by the width of a leaf and the size of a hand rather than by the capacity of a rice cooker. Roughly 150 g cooked at a meal, not 450.
The vegetables, in volume, and cut fine: thoran dressed with raw grated coconut, mezhukkupuratti barely smeared with oil, avial thick with a coconut-and-cumin paste, olan in thin coconut milk with almost no spice at all, greens, and the ten-leaf pathila thoran of Karkidakam. Half the meal by area and considerably more than half by weight.
A pulse, present rather than occasional: vanpayar, muthira, kadala, parippu, cherupayar, in a thoran or an erissery or a curry or simply boiled.
Fish, more often than meat, because it was closer and cheaper: mathi, ayala, kozhuva, karimeen, neymeen, mussels, prawns. Red meat at feasts and on Sundays.
The souring fruit rather than the rich sauce: kudampuli in the fish curry, tamarind in the sambar, raw mango in season, curd and buttermilk to close a meal.
Coconut as flesh and milk, in quantity, and coconut oil in teaspoons — because it was hand-pressed and it cost something, and because a thoran needs a smear rather than a bath.
Six tastes at one sitting, as the tradition explicitly required: sweet, sour, salty, pungent, bitter and astringent, which is a framework that happens to produce a varied, high-fibre, well-balanced plate.
And a fermented or steamed breakfast, with a legume beside it, prepared the night before.
That is the plate. It was displaced by law, by import economics, by remittance prosperity, by refined flour, by the tea shop and by the packet, in that rough order, over about fifty years. None of those forces was a conspiracy and most of them were, in their own terms, progress.
The rest of this book puts the plate back, with a scale on the counter.
Chapter 3 — Your Numbers, Not Theirs
The most dangerous sentence in this book's subject area
"But I'm not even overweight."
It is said by a great many South Asian readers, usually with a BMI between 23 and 25, and it is the single most consequential misunderstanding this book has to take apart. It is not stupidity or denial. It is the entirely reasonable consequence of being measured against a scale that was built on other people's bodies.
Two figures make the problem concrete before we get to the cut-offs. In the Indian Diabetes Prevention Programme, participants who progressed to diabetes were doing so at a mean BMI of 25.8 ± 3.5 kg/m² at a mean age of 45.9 (Ramachandran et al., 2006). In the Finnish Diabetes Prevention Study, the comparable participants had a mean BMI of 31 at a mean age of 55 (Tuomilehto et al., 2001). Same disease, same trial design, same era. Five and a half BMI points and nine years of life apart.
If your mental model of "the sort of person who gets type 2 diabetes" was formed from Western reference images, it is calibrated about five BMI points too high for your own body.
The Asian Indian cut-offs, printed as they stand
The current authority is the revised Indian national consensus, Revised definition of obesity in Asian Indians living in India (Misra et al., 2025; DOI 10.1016/j.dsx.2024.102989). Its cut-offs are as follows, and they are printed here verbatim because paraphrasing them is how they get lost.
| Measure | Cut-off for Asian Indians |
|---|---|
| BMI, normal | 18.5–22.99 kg/m² |
| BMI, Grade I obesity | 23.0–24.9 kg/m² |
| BMI, Grade II | 25.0–27.5 kg/m² |
| BMI, Grade III | 27.6–32.4 kg/m² |
| BMI, Grade IV | ≥32.5 kg/m² |
| Waist circumference, men | ≥90 cm |
| Waist circumference, women | ≥80 cm |
| Waist-to-height ratio | >0.5 |
| Body fat, men | >25.5% |
| Body fat, women | >38% |
Grade I obesity begins at a BMI of 23.0. Not overweight; the statement's own term is obesity, Grade I. A woman of 1.60 m weighing 59 kg has a BMI of 23.0 and is at the boundary. In most of the world's clinics she would be told she is fine.
The same statement adds a two-stage clinical framing that is genuinely useful, and more humane than a single number. Stage 1 obesity is increased adiposity — BMI above 23 — with no discernible effect on organ function or on daily activities. Stage 2 obesity is BMI above 23 plus a raised waist circumference or waist-to-height ratio plus functional symptoms or an established comorbidity. That distinction does two things at once: it lets a reader at BMI 24 with a 92 cm waist and a rising HbA1c understand that she is not fine, and it stops us telling a reader at BMI 24 with a 78 cm waist and normal bloods that she has a disease.
Where the 23 came from, and what WHO actually said
Precision matters here, because the usual shorthand is wrong and the wrongness is quotable against us.
You will very often read that "WHO lowered the BMI cut-off for Asians to 23". WHO did not. The WHO Expert Consultation on appropriate body-mass index for Asian populations concluded that the proportion of Asian people at high risk of type 2 diabetes and cardiovascular disease is substantial at BMIs below the existing overweight threshold of 25; found that the BMI at which observed risk begins to rise varies from 22 to 25 kg/m² across Asian populations, and for high risk from 26 to 31; declined to redefine the cut-offs population by population; and retained the standard WHO international BMI classification. What it did instead was identify public health action points at 23.0, 27.5, 32.5 and 37.5 kg/m² (WHO Expert Consultation, 2004; PMID 14726171).
So the correct sentence is: WHO identified 23.0 as a public health action point and kept the international classification; the Indian national consensus, two decades later, went further and defined 23.0–24.9 as Grade I obesity for Asian Indians living in India. Say it that way. It is more accurate, it is more defensible, and the reader who checks will find you were careful.
Why the waist beats the weight, with the numbers
Body mass index has one virtue: it needs only a scale and a height. Against that, it cannot distinguish muscle from fat, and it cannot see where the fat is, which for this population is the whole question.
Waist-to-height ratio is better, and the margin has been quantified. A systematic review of 78 studies across 14 countries, covering Caucasian, Asian and Central American subjects, found the mean boundary value for waist-to-height ratio to be 0.50 in men and 0.50 in women, with a mean area under the receiver-operating curve of 0.704 for waist-to-height ratio, 0.693 for waist circumference and 0.671 for BMI (Browning, Hsieh and Ashwell, 2010). A subsequent meta-analysis of more than 300,000 adults across several ethnic groups found that waist-to-height ratio improved discrimination of adverse cardiometabolic outcomes by 4–5% over BMI (P<0.01), waist circumference by 3% (P<0.05), and that waist-to-height ratio was significantly better than waist circumference for diabetes, hypertension and cardiovascular disease in both sexes (P<0.005) (Ashwell, Gunn and Gibson, 2012).
Four to five per cent is not a revolution, and it should not be sold as one. What makes waist-to-height ratio the right primary measure for this book is everything around the statistics. It needs no scale, which matters in a great many Kerala and diaspora households. It is height-adjusted, which matters across a readership ranging from 1.48 m to 1.85 m. It has a single boundary value, 0.5, that does not change with sex or ethnicity. It can be done with a piece of string. And it is the number that moves when the fat that matters moves.
The string method
Take a length of string and cut it to your height, standing straight, from the floor to the top of your head. Fold it exactly in half. Now pass the folded string around your waist at the measuring point described below. If the two ends meet or overlap, your waist is less than half your height and your ratio is under 0.5. If they do not meet, it is over. Ashwell's own formulation of the rule is as plain as public health messaging ever gets: keep your waist circumference to less than half your height. No arithmetic, no scale, no conversion, and nothing to look up.
How to measure a waist, properly
Most people measure their waist badly, and the errors are large enough to matter. A 3 cm inconsistency between one week and the next is entirely achievable with a careless technique, and 3 cm is more than most people will lose in a month of good work. The measurement has to be repeatable before it is useful.
Where the tape goes. Not at the navel, and not at the waistband of your trousers. This book follows the World Health Organization's STEPS protocol, which is the instrument behind most of the prevalence figures quoted in this chapter, and its instruction is one sentence: measure "at the midpoint between the lower margin of the last palpable rib and the top of the iliac crest (hip bone)". Put your fingers on your side and feel for both bones. In most adults the midpoint sits above the navel, and in an adult with substantial abdominal fat it may sit well above it. Find the two bones, find the midpoint, and mark it if you need to.
The rest of the WHO protocol is worth having, because it is where the repeatability comes from. Stand with your arms relaxed at your sides. Take the measurement at the end of a normal breath out — not held in, not pushed out. "Check that the tape is horizontal across the back and front of the participant and as parallel with the floor as possible." Keep the tape "snug but not tight enough to cause compression of the skin", and read to the nearest 0.1 cm.
One thing to know, because it explains why published waist numbers disagree. WHO STEPS is not the only protocol in use. The United States' NHANES survey measures somewhere else entirely: its examiners "draw a horizontal line just above the uppermost lateral border of the right ilium", crossed at the midaxillary line, and measure there. That is the top of the hip bone rather than the midpoint above it, and in most adults it produces a larger number than the WHO landmark on the same body. Neither protocol uses the navel. So if you compare your figure with one from an American source, or with a number a clinic gave you years ago, check which landmark was used before you conclude anything from the difference. Whichever you choose, use the same one every single time.
When in the day. First thing in the morning, after using the bathroom, before eating or drinking. Abdominal girth varies through the day by more than most people expect, largely from gut contents and fluid, and morning is the least variable point.
Standing, not sitting. Feet together or a hand's width apart, weight even, arms relaxed at your sides. Do not brace, do not pull in, do not stand taller than you normally do.
Breathing out, not in. Take a normal breath and let it out, and read the tape at the end of that normal exhalation. Do not empty your lungs and do not hold a big breath. Holding a breath in shrinks the number and comforts nobody.
Skin, or one thin layer. Measure against bare skin if you can, and against one thin layer if you cannot. A shirt is 2 to 4 mm on each side of the tape and the effect compounds.
Snug, not tight. The tape should sit flat all the way round, level with the floor at the back as well as the front — a mirror or a second pair of hands helps here — and should touch the skin without compressing it. If you can see the tape denting you, it is too tight.
The same tape, the same time, once a week. Different tapes disagree, cloth tapes stretch with age, and a tape that has lived in a drawer for a decade is not the instrument it was. Buy one, keep it for this job, and replace it if it looks tired. Measure on the same morning each week, at the same point in the week, and write the number down. The progress pages at the back of this book exist for exactly this.
Take three readings and use the middle one if they disagree by more than half a centimetre. If they disagree by more than 2 cm, your landmark is moving and you should find the bones again.
The case for the waist rather than the weight, for this reader specifically, comes down to noise. Body weight on any given morning contains several kilograms of variation that has nothing to do with fat — glycogen and its associated water, salt and its associated water, gut contents, and for women the menstrual cycle. Weight is noisy over a week and honest over a month. Waist is quieter, and it is measuring the compartment that Chapter 4 shows to be the one that matters in South Asian bodies. There is also a practical argument: for a great many readers the waist will move perceptibly before the scale does, and being able to see that early is worth a good deal in the weeks when motivation is thin.
Weigh yourself as well, if you find it helpful; the self-monitoring evidence in Chapter 5 is genuinely strong. But if you are going to keep one number, keep the waist.
A word on the bathroom scales that also report body fat percentage. The Indian consensus does give body fat cut-offs — above 25.5% for men and above 38% for women (Misra et al., 2025) — and they are useful figures if you have an accurate measurement. Consumer bioimpedance scales are not that. They estimate body fat by passing a small current through your feet and inferring composition from the resistance, which makes the reading sensitive to how hydrated you are, how recently you ate, how warm your feet are and whether you have just showered. The number will move by several percentage points between morning and evening in the same unchanged body. If you own such a scale, treat its fat percentage as a very rough trend line over months and not as a measurement, and do not let a bad reading on a dehydrated Tuesday tell you anything.
And if you measure your waist this week and find you are already well over the line — 96 cm, or 104 cm, or a ratio of 0.62 — the number is information and not a verdict. Chapter 6 exists precisely for that reader, and its central finding is that the amount of change associated with substantial clinical improvement is smaller than almost anyone expects.
The blood work
Measurement of the outside is free and immediate. Measurement of the inside requires a laboratory, and it tells you things the tape cannot.
Ask for, or expect, the following.
HbA1c — glycated haemoglobin, which reflects average blood glucose over roughly the preceding two to three months and does not require fasting. It is the single most useful glucose measure for tracking change, because it cannot be gamed by one careful day.
Fasting plasma glucose, which is what the queue at seven in the morning is for.
A full lipid profile, and specifically one that reports total cholesterol, LDL cholesterol, HDL cholesterol, triglycerides, and non-HDL cholesterol. Non-HDL cholesterol is simply total cholesterol minus HDL cholesterol; you can calculate it yourself from any lipid panel, and it captures all the cholesterol carried by potentially atherogenic particles rather than only the LDL fraction. Where a laboratory reports apolipoprotein B, that is useful too. Triglycerides deserve individual attention in this population, and Chapter 4 explains why.
Liver enzymes — alanine aminotransferase and aspartate aminotransferase, usually reported as part of a liver function panel. Chapter 4 sets out why the South Asian liver is the organ this book is most interested in, and why a mildly raised ALT in a person who drinks little is a finding rather than a footnote.
And, once, lipoprotein(a). Lp(a) is a genetically determined lipoprotein, largely fixed for life, disproportionately elevated in South Asians, and essentially unresponsive to diet. That combination makes it sound useless in a cookbook, and it is precisely the opposite. Because it cannot be changed by what you eat, knowing whether yours is high changes how hard the things that can be changed are worth pushing. In the Multi-Ethnic Study of Atherosclerosis, elevated Lp(a) together with raised high-sensitivity CRP carried a hazard ratio of 1.39 (95% CI 1.06–1.82) for coronary heart disease, rising to 2.02 (1.26–3.24) when Lp(a), hs-CRP and homocysteine were all elevated (Nomura et al., 2025); the conventional threshold for "elevated" is above 50 mg/dL. It is a single test, usually needed only once in a lifetime, and it is worth asking your doctor whether it is appropriate for you.
How often. For a reader with normal results and no diagnosis, an annual panel is a reasonable default and your clinician may suggest otherwise. For a reader with prediabetes or diagnosed diabetes, HbA1c is conventionally repeated every three to six months, because three months is roughly the window the measure integrates over. For a reader actively changing their diet, three months is also the shortest interval at which a re-test tells you anything real: repeating an HbA1c after four weeks measures mostly the four weeks before you started.
And now the instruction that matters more than any of the above. Do not interpret these results yourself, and do not interpret them from this book. This chapter has deliberately not printed diagnostic thresholds for fasting glucose, HbA1c, LDL cholesterol or liver enzymes, and the omission is not an oversight. Those thresholds differ between guidelines, they are revised, they depend on your age and your other risk factors, and a number that is unremarkable in one person is urgent in another.
Take the printout to a clinician. Ask what each number means for you specifically, what they would like it to be, and by when. Ask whether anything on the sheet changes what you should eat, and whether any change you are planning to make requires a change in your medication. Write the answers down. Then come back to this book, and cook.
That sequence — measure, ask, cook, re-measure — is the whole of the method. Everything else is detail.
Chapter 4 — The Thin-Fat Problem
The correction
There is a version of the South Asian metabolic story that most well-read readers already know, and it is wrong in an interesting and important way.
The folk version runs like this: South Asians carry more visceral fat than Europeans at the same body mass index, that visceral fat is metabolically active and drains into the portal vein, and that is why diabetes arrives at a lower BMI. It is a good story. It appears in a great many books and a great many clinic conversations. It is, in the part that matters, not what the imaging data say.
The strongest evidence is a systematic review and meta-analysis of imaging data from eight published and three unpublished datasets — 1,156 South Asian and 2,891 white European men, and 697 South Asian and 2,271 white European women (Iliodromiti et al., 2023; PMID 36224274). The findings:
South Asian men, despite a BMI 0.5 to 0.7 kg/m² lower than their white European comparators, showed +0.56 standardised mean difference in liver fat (95% CI 0.14–0.98) and +0.34 SMD in subcutaneous fat (0.12–0.55) — with visceral fat essentially identical, at −0.03 SMD (−0.24 to 0.19).
South Asian women, at a BMI about 0.9 kg/m² lower, showed +0.31 SMD in liver fat (0.14–0.48), with neither subcutaneous nor visceral fat significantly different.
The authors' conclusion is that South Asians store more ectopic fat in the liver at similar BMI levels, and that this helps explain their greater diabetes risk.
The distinctive South Asian lesion is liver fat, not visceral fat. At matched body mass index, the visceral compartment is not the one that differs. The liver is.
This is not a technicality. It changes what the intervention should target. Visceral fat, in the popular framing, is a vaguely mechanical problem, something to be exercised off. Liver fat is a substrate problem, and the substrates are total energy, refined carbohydrate, fructose and alcohol — which is to say, exactly the things a cookbook can change. The correction makes the case for this book stronger rather than weaker.
The American data agree and add a caution. In the MASALA and MESA cohorts, comparing 803 South Asians with 2,622 white, 1,893 Black, 1,496 Latino and 803 Chinese American adults, all free of cardiovascular disease at baseline, South Asians had the highest intrahepatic fat and the lowest pericardial fat volume of the five groups (Garg et al., 2016). The caution is in the same paper: ectopic fat differences explained only a small fraction of South Asians' higher coronary calcium burden, and the authors state that ectopic fat depots may not explain the elevated risk. Liver fat is the most distinctive and most actionable part of the picture. It is not the whole of it, and this book will not pretend otherwise.
Diabetes at 23%, and a pancreas that does not compensate
The prevalence figures from the same cohorts are the ones that tend to stop a diaspora reader mid-page. Among 799 South Asians in MASALA compared with four MESA groups, aged 44 to 84, age-adjusted diabetes prevalence was 23% in South Asians, against 6% in white Americans, 18% in African Americans, 17% in Latinos and 13% in Chinese Americans (Kanaya et al., 2014; PMID 24705613).
Nearly four times the white American figure. And the gap widened after adjustment for sociodemographic, lifestyle and metabolic confounders, which is to say that the usual explanations do not account for it and adjusting for them makes it look worse.
The mechanism is in the same paper, and it has two halves. After adjusting for age and adiposity, South Asians showed significantly higher HOMA-IR and significantly lower HOMA-β than every other group. HOMA-IR is an index of insulin resistance; HOMA-β is an index of beta-cell function. More resistance, and less capacity to compensate for it. The authors' conclusion is that the excess is not explained by traditionally measured risk factors, and that South Asians may have lower beta-cell function and an inability to compensate adequately.
Consider what that combination means. Insulin resistance on its own does not produce diabetes; it produces higher insulin. Diabetes appears when the pancreas can no longer keep up. A population with more resistance and less reserve has a shorter runway at every level of body fat. That is the physiological content of the IDPP-1 versus Finnish DPS comparison from Chapter 3 — diabetes arriving at a mean BMI of 25.8 rather than 31 — and it is why the Grade I obesity cut-off of 23.0 exists.
The Indian trial data fill in the picture from home. In IDPP-1's cohort of people with impaired glucose tolerance, HOMA-IR of 4.1 or above was present in 69.1%, with no difference between the sexes, and metabolic syndrome in 46.4% overall and 61.9% of the women (Ramachandran et al., 2007). And a mechanistic follow-up found that among those with impaired glucose tolerance, having both high insulin resistance and low beta-cell function at baseline gave a diabetes incidence of 54.9%, against 33.7% in those with neither abnormality (P=0.006) — while normal beta-cell function combined with improving insulin sensitivity facilitated reversion to normal glucose regulation (Snehalatha et al., 2009).
That last clause is the hopeful one, and it is not decoration. Reversion happened. Chapter 6 sets out how often, and on how much weight loss.
Yajnik's phrase, and where it does and does not hold
The term that describes all of this is Chandrakant Yajnik's: the thin-fat phenotype. Neonatal anthropometry from the Pune Maternal Nutrition Study described Indian newborns as light and short but relatively fat-preserving, with subscapular skinfold better preserved than lean tissue (Yajnik et al., 2003).
The phrase has become so useful that it is worth being careful about its evidence base. The neonatal claim is actively contested; two subsequent papers in the Journal of Nutrition have reconsidered the thin-fat Indian neonate and argued that the thin-but-fat phenotype is uncommon at birth in Indian babies. The adult claim is not contested at all, and the imaging meta-analysis above is its strongest support. So: use "thin-fat" as a description of adult South Asian body composition, where it is well founded, and treat the birth-weight version as an open question rather than a settled premise.
What the adult phenotype means in practice is that a South Asian body at a given weight tends to carry more of that weight as fat and less as skeletal muscle than a European body at the same weight — and that a disproportionate share of the fat is in the liver. Two consequences follow, and both shape this book. Protein intake matters more, because there is less muscle to lose and less to spare; the traditional rice-and-coconut plate is easy to eat at 0.6 to 0.8 g of protein per kilogram of body weight, and Chapter 5 explains why 1.2 to 1.6 g/kg is the target. And resistance training stops being optional, because a body with limited muscle reserve entering an energy deficit needs a reason to keep what it has.
The liver, in numbers, and why this is not an abstract concern
Fatty liver in India is not a rare finding requiring a specialist referral. It is close to a background condition.
In a general-population screening study of 1,243 participants assessed by transient elastography, overall metabolic dysfunction-associated steatotic liver disease prevalence was 43.7%, with prevalence of 21.3% in lean and 66.7% in non-lean subjects, and lean MASLD accounting for 9.7% of all cases (Prasad et al., 2024). Among 345 Indian information-technology employees assessed by FibroScan, 84.06% had metabolic dysfunction-associated fatty liver disease, alongside 70.7% obesity, 71.9% sitting for long hours, 69.9% sleep deprivation and 76.5% raised LDL cholesterol (Bhargava et al., 2025).
And the figure that ought to be printed in every South Indian family's kitchen. Among 688 healthy medical students in South India, mean age 20.5, with no significant alcohol use, controlled-attenuation-parameter assessment found hepatic steatosis in 23.1%, with the parameter correlating with BMI (r=0.38, P<0.001), waist circumference (r=0.37, P<0.001) and hip circumference (r=0.32, P<0.001) — and BMI the only independent predictor (Desai et al., 2025).
Nearly a quarter of healthy South Indian medical students, in their early twenties, already have fat in their livers. Not patients. Not a clinic sample. Students, screened.
If you are a diaspora reader in your forties wondering whether any of this applies to you, that is the number to sit with.
Lipoprotein(a), briefly, and honestly
Lp(a) belongs in this chapter because it is part of the South Asian risk picture and because it is the clearest example in the book of something food does not fix.
It is a lipoprotein particle whose blood concentration is largely determined genetically, is stable across adult life, is disproportionately elevated in South Asian populations, and does not respond meaningfully to diet. In MESA, elevated Lp(a) combined with raised hs-CRP conferred a hazard ratio of 1.39 (1.06–1.82) for coronary heart disease, rising to 2.02 (1.26–3.24) when Lp(a), hs-CRP and homocysteine were all elevated (Nomura et al., 2025).
There is no recipe in this book that lowers it, and any book that claims otherwise is selling you something. Its practical role is exactly the one described in Chapter 3: get it measured once, and let the answer inform how hard you and your clinician push on everything that is modifiable — LDL cholesterol, blood pressure, waist circumference, glycaemia, smoking and physical activity.
What "inch loss" physically is
The phrase "inch loss" is used loosely enough in this industry to be worth defining properly, because when it is defined properly it turns out to describe something real.
Your waist circumference integrates two fat compartments and one non-fat variable. Subcutaneous abdominal fat sits under the skin, is the fat you can pinch, and is metabolically comparatively inert. Visceral adipose tissue sits inside the abdominal cavity, wrapped around and between the organs — omental and mesenteric fat — and it drains into the portal vein, which means its metabolic products arrive at the liver first and at high concentration. Visceral fat is therefore tightly coupled to liver fat, which is the depot that matters most for South Asians. The non-fat variable is gut contents and fluid, which is why the measurement protocol in Chapter 3 is as fussy as it is.
Now the useful part: liver fat is also the depot that changes fastest. In Taylor's Counterpoint study, 12 people with type 2 diabetes of under four years' duration ate about 800 kcal a day as a liquid formula for eight weeks. Mean weight loss over the whole eight weeks was 15.3 kg. But liver fat fell by roughly one-third within seven days, and fasting plasma glucose normalised at day 7 — before most of the weight had gone (Lim et al., 2011, as reviewed in Taylor, 2025).
Seven days. Before the weight. That is the physiological basis for the only promise this book makes about timing, and it is worth stating precisely:
The blood tests move before the tape measure does, and the tape measure moves before the mirror does.
Visceral fat is lost preferentially, proportionally, and early, but the advantage narrows as weight loss continues. Allometric modelling shows that the preferential loss of visceral relative to subcutaneous fat attenuates as total weight loss increases. So the honest statement is: early in an energy deficit, a disproportionate share of what you lose comes from the visceral and hepatic compartments, which is why the waist and the blood markers improve faster than total weight loss alone would predict; later, the losses even out. Do not over-claim it, and do not expect the first month's rate of waist change to continue indefinitely.
This is also the answer to the reader who loses 3 cm from her waist and 1 kg on the scale in a month and concludes that the scale is broken. The scale is not broken. Those two numbers are measuring different things, and in the first weeks of a deficit the waist is the more informative of the two.
Spot reduction does not work, and this book will not pretend it does
The last thing this chapter has to do is close a door.
Twenty-four sedentary adults were randomised either to six weeks of abdominal exercise — seven exercises, two sets of ten repetitions, five days a week — or to a control condition, with diet held constant in both arms (Vispute et al., 2011; PMID 21804427). The abdominal training group improved substantially on abdominal muscular endurance, from 32 ± 9 curl-ups to 47 ± 13. On body weight, body fat percentage, android fat percentage, android fat, abdominal circumference, abdominal skinfold and suprailiac skinfold, there was no significant effect. The authors' conclusion, verbatim: "Six weeks of abdominal exercise training alone was not sufficient to reduce abdominal subcutaneous fat."
Crunches build the muscle under the fat. They do not remove the fat over it. Waist reduction comes from an energy deficit, and specifically from the hepatic and visceral compartments emptying, which happens as a whole-body process and cannot be aimed.
The consequence for this book is a promise about what it will not contain. No food in these pages targets a body part, and no exercise in these pages targets a body part. There is no dish for belly fat, no drink that works on your waist, no morning routine for your midsection. There is a plate designed to produce an energy deficit you can live inside for years, with enough protein to keep your muscle and enough vegetable volume to keep you full, and there is resistance training and walking because they preserve lean mass and lower blood pressure. The waist follows. It follows reliably, and it follows early, for the reasons set out above. It just does not take instructions.
What the thin-fat problem actually asks of you
Not more discipline. A different target. If the South Asian lesion is liver fat rather than visceral fat, then the levers are total energy, refined carbohydrate, fructose and alcohol — and the two structural edits that matter most are the ones this book makes on every page: bound the grain, and add a pulse and a protein to every meal. Chapter 6 gives the numbers on how much change that has been shown to produce, and they are more encouraging than most readers expect.