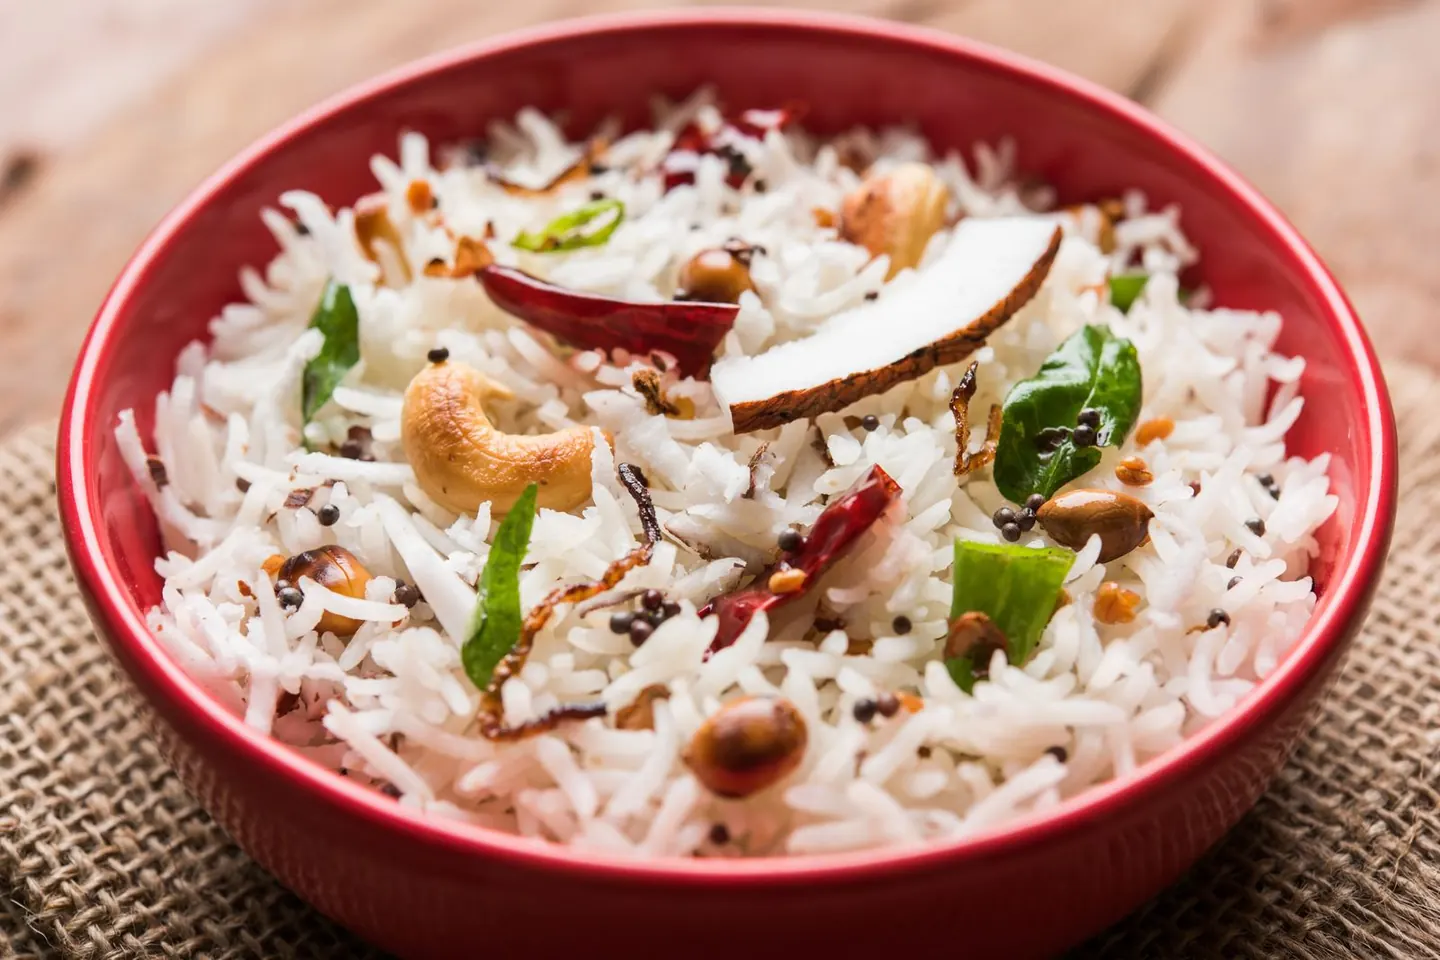
Chapter 7 — The Rice Question
A Malayali plate is organised around rice the way a sentence is organised around its verb. The thoran, the parippu, the fish, the spoonful of achar at the edge are modifiers; rice is the thing being modified. In Malayalam, choru is cooked rice, and in ordinary speech it carries the meal itself — to ask whether someone has eaten is to ask whether they have had choru.
So when a doctor with eleven minutes per patient says "cut down the rice," the sentence arrives in a Malayali ear as cut down eating. Most readers then do one of two things, and both fail: comply for six weeks, lose four kilograms, and return to the old plate with a new layer of guilt; or refuse outright, decide that nutrition science does not understand Indian food, and change nothing. Neither is what the evidence recommends, because the evidence does not say give up rice. What follows is the argument in full, including the parts that disappoint. It ends in four words, and they are not stop eating rice.
The one number a cook can act on
Most research on rice and metabolic risk is expressed in "servings," and a serving is a unit invented by researchers. Nobody in Kerala has ever served a serving. This is why the most useful study in the rice literature is the one that abandoned servings and measured cooked grams.
The Prospective Urban Rural Epidemiology study followed 132,373 people aged 35 to 70 in 21 countries for a mean of 9.5 years, recording 6,129 new cases of diabetes, and categorised intake as under 150 g, 150 to under 300 g, 300 to under 450 g, and 450 g or more of cooked white rice per day (Bhavadharini et al., 2020). Highest band against lowest, the hazard ratio for incident diabetes was 1.20 (95% CI 1.02–1.40) overall, with a significant trend across bands. Split by region it separated sharply: South Asia, 1.61 (95% CI 1.13–2.30); other regions pooled, 1.41; China, 1.04 (0.77–1.40) — no association at all.
Two things follow, and they pull in opposite directions. The risk signal in South Asian populations is real and it is the largest of the regional estimates. But a food that behaves one way in Chennai and another in Guangzhou is not acting alone: rice in China arrives with more vegetables and more soy, while rice in South Asia arrives increasingly with sweetened tea, refined-flour snacks, less physical work and more of itself. PURE cannot separate the grain from its company. What it can do, better than any other study, is name the quantity at which the association appears, in a unit you can put on a kitchen scale.
The trial's own conversion is that one cup of cooked rice weighs about 150 g. So the highest-risk band, 450 g a day, is three cups: two at lunch and one at dinner, or the single generous midday plate handed over at a thattukada with sambar poured on top. That is a normal Kerala intake, not an extreme one. The lowest band, under 150 g for a whole day, is one cup, which is a real ask in a rice culture. The workable target sits between: move a plate carrying 450 g or more into the 150 to 300 g range across the day. One change, expressed in grams, and the largest single lever in this book.
The dose–response line
The meta-analytic evidence runs the same way and supplies the slope. Pooling seven prospective cohort comparisons across 352,384 participants and 13,284 incident cases, highest against lowest white-rice intake gave a relative risk of 1.27 (95% CI 1.04–1.54), and the dose–response estimate was 1.11 (95% CI 1.08–1.14) per additional daily serving (Hu et al., 2012). Asian cohorts gave 1.55 (1.20–2.01) and Western cohorts 1.12 (0.94–1.33), not significant, with a test for interaction by ethnicity at P = 0.038. Asian participants ate three to four servings a day; Western participants one to two a week.
Those authors were careful about their own limits, and the caveat protects the reader from twenty years of marketing: because Asian populations eat white rice almost exclusively, no data on brown rice and diabetes risk exist in these populations, and the substitution finding rested on a single Western study. Which brings us to the trial that tested the substitution directly, in Indians.
The disappointment this book has to own
If the story were "white rice raises risk, therefore eat brown," then swapping should improve the numbers. It was tested. In Chennai, 166 overweight adults aged 25 to 65 with a BMI of 23 or above ate two ad libitum meals a day, six days a week, for three months, in a randomised crossover with a two-week washout, in which the only planned change was parboiled brown rice in place of white (Malik et al., 2019). The result was no significant overall between-diet difference in the primary glycaemic and lipid markers.
There were subgroup signals worth knowing. In participants with metabolic syndrome, HbA1c fell 0.18 percentage points on brown rice (P = 0.03); in those with a BMI of 25 or above, HbA1c and cholesterol improved; the rise in high-sensitivity CRP was smaller, 0.03 against 0.63 mg/L (P = 0.04). But subgroup findings from a trial with a null primary result are hypotheses, not conclusions. The honest summary is the one the trial supports: a three-month real-world swap of brown for white rice did not move HbA1c in the group as a whole. Any book telling you the answer to the rice question is brown rice has not read this trial. The grain swap is a refinement, not the intervention.
What did work: fifty grams
The same group had already shown what a bigger lever looks like. Fifteen overweight Asian Indians ate each of three test diets for five days in a randomised crossover, wearing continuous glucose monitors (Mohan et al., 2014). Against white rice, the five-day average incremental area under the glucose curve was 19.8% lower with brown rice (P = 0.004) and 22.9% lower with brown rice plus 50 g a day of legumes (P = 0.02). Fasting insulin change was 57% and 54% lower respectively.
Read those two numbers next to each other. Changing the grain bought 19.8%. Adding 50 g of parippu, vanpayar, muthira or kadala to the same plate bought three percentage points more on top, and it did so by adding something rather than taking something away. Fifty grams cooked is one small ladle.
This is a very small, very short study, and a mechanism demonstration rather than an outcome trial. But it is not alone. Pulses at a median 130 g a day lowered LDL cholesterol by 0.17 mmol/L, about 6.6 mg/dL, across 26 randomised trials in 1,037 people (Ha et al., 2014); at a median 132 g a day they produced a weight reduction of 0.34 kg across 21 trials, including in diets with no calorie restriction (Kim et al., 2016); and as part of a low-glycaemic-index diet at a cup a day they lowered HbA1c by 0.5 percentage points and systolic blood pressure by 4.5 mmHg over three months in 121 adults with type 2 diabetes (Jenkins et al., 2012). Four independent bodies of evidence, one direction. The pulse on the plate is the best-supported single instruction in this book, and it costs nothing but remembering to soak something overnight.
The pulse rule, and where it comes from Every plate in this book carries at least 50 g of cooked pulses. That figure was not chosen for tidiness; it is the dose that outperformed a whole-grain swap on continuous glucose monitoring in overweight Asian Indians (Mohan et al., 2014). One small ladle of parippu, a spoonful of vanpayar thoran, a scoop of kadala curry beside the puttu. If you remember one instruction from Part One, remember this one.
Polish, not colour
The rice conversation in Kerala is conducted in colours: white against red, white against brown. That is the wrong axis. Rice as a category has a mean glycaemic index of 67, standard deviation 17, and a range from 19 to 116 (Atkinson et al., 2021); white rice averages 73 and brown 65. The spread within the category is far wider than the gap between the labels, which means variety, amylose content, processing and cooking time each move the number more than the bran layer does.
The most instructive Indian measurement isolates one variable, and that variable is polishing. In a single parboiled Indica variety, glycaemic index was 57.6 for the brown grain, 73 at 2.3% polish, and 79.6 at 9.7% polish, with 24-hour incremental glucose areas of 34.7, 55.5 and 58.4 (Shobana et al., 2017). The authors' conclusion is the sentence a Kerala reader most needs: any degree of polishing leads to higher glycaemic responses. Even the light cosmetic polish that makes rice look cleaner in the sack wiped out most of the advantage.
That is good news, because polish is the one property of rice Kerala can still buy its way out of. Unpolished or minimally milled parboiled matta is available, and it is what Kerala ate before the 1969 land reforms and the collapse of household paddy pushed the state onto imported polished white rice. Everything else about the grain — its colour, its provenance, the romance of the variety name — is a smaller lever than whether the mill took the outer layers off.
Parboiling, properly explained
Parboiling is Kerala's inherited technical advantage, and it is routinely oversold. Two claims get bundled together; only one is solid.
The nutritional claim is solid and quantified. Steaming or soaking paddy before milling drives water-soluble B vitamins inward from the bran, so they survive the mill. Per 100 g, milled parboiled rice carries 0.17 mg of thiamine against 0.05 mg in raw milled rice, with 2.51 mg niacin against 1.69 and 0.22 mg total vitamin B6 against 0.12 (Longvah et al., ICMR-NIN Indian Food Composition Tables, 2017). Brown rice carries more still, 0.27 mg. That roughly three-and-a-half-fold thiamine advantage is why beriberi historically tracked polished non-parboiled rice, and a reader can be told it without hedging.
The glycaemic claim needs a caveat most writing on Kerala rice omits. In the best systematic review of rice processing and postprandial response, amylose content emerged as the most consistently important source of variation, and the parboiling effect proved conditional: pressure parboiling reduced glycaemic index by nearly 30% in some cases, while traditional mild parboiling had minimal effect (Boers et al., 2015). The benefit belongs to severe industrial pressure parboiling, and you cannot tell from the sack which kind your matta received. The same review trims another belief: at identical cooking times brown rice always gave lower postprandial glucose, but at the longer times brown rice actually needs, the advantage narrowed or vanished. Overcooked brown rice is not superior to properly cooked white rice. Buy parboiled for the thiamine and unpolished for the glycaemic index — and do not assume the word "parboiled" on a sack has bought you a low-glycaemic food.
Chilling cooked rice: a real effect, and a warning that travels with it
When cooked rice cools, some gelatinised amylose recrystallises into a form that resists digestive enzymes. This is retrogradation, and it is measurable. Resistant starch in freshly cooked white rice was 0.64 g per 100 g; after 10 hours at room temperature, 1.30 g; after 24 hours at 4°C (39°F) and reheating, 1.65 g. In 15 healthy adults in a randomised single-blind crossover, the chilled-and-reheated rice gave a lower glycaemic response than freshly cooked rice, area under the curve 125 ± 50.1 against 152 ± 48.3 mmol·min/L (P = 0.047), about 18% lower (Sonia et al., 2015). The effect survives reheating, which is what makes it usable in a kitchen. Be honest about the size, though: the absolute gain is about 1 g of resistant starch per 100 g of cooked rice, from small and short studies. This is a refinement to a well-portioned plate, not a way to make an unportioned one safe.
Now the warning, and it is not a formality. In 32 adults with type 1 diabetes on insulin pump therapy, long-grain white rice cooled 24 hours at 4°C and reheated produced a lower peak glucose (9.9 against 11.0 mmol/L, P = 0.0056), a smaller maximum rise (2.7 against 3.9 mmol/L, P < 0.0001) and a much smaller area under the curve — and 12 hypoglycaemic episodes against three (P = 0.0039), because participants dosed insulin for the carbohydrate count they were used to (Strozyk et al., 2022). The technique worked exactly as intended, which is precisely why people went low. If you use insulin, or a sulfonylurea such as glimepiride or gliclazide, this method changes the glucose response to a food whose dose you have already calibrated. Do not adopt it as a routine without telling the clinician who set that dose, and expect to monitor while you do. Nothing in this book asks a reader to alter a medication, and this section least of all.
A second, unrelated hazard belongs here in plain language, and this one has an authority behind every number. The UK Food Standards Agency's Home food fact checker states that "uncooked rice can contain spores of a bacterium called Bacillus cereus", that "the spores of Bacillus cereus can survive being cooked", and that leftover rice should be chilled "as quickly as possible, ideally within one hour", kept "in the fridge for no more than one day until reheating", and reheated so that "it is steaming hot all the way through". The FSA is explicit on the last point: "you should never reheat rice more than once." The FDA's Bad Bug Book explains why reheating is not a rescue — the emetic toxin, cereulide, "is stable after heating at 121°C [250°F] for 30 minutes, cooling at 4°C [39°F] for 60 days, and at a pH range of 2 to 11". So: spread the rice shallow, chill within the hour, keep it 24 hours and no longer, reheat once until steaming hot throughout, and never reheat the same rice twice. The FDA Food Code puts a thermometer on "steaming hot": reheated food should reach 74°C (165°F) throughout.
Kanji vellam: what is true, and what is inherited belief
Kerala cooks rice in excess water and pours off the starchy liquid, and two opposite folk claims attach to it. One says the water carries away the carbohydrate, making rice safe for a diabetic. The other says the water is the nourishing part and should be drunk. The evidence supports neither as stated.
What draining verifiably does is remove inorganic arsenic. Absorption cooking without washing removed 9% of inorganic arsenic from brown rice and 32% from white; washing or pre-soaking then absorbing removed about 18% and 44%; and blanching in pre-boiled water, discarding that water, then finishing by absorption removed 54% from brown rice and 73% from white, preserving zinc entirely and losing only about 5% of manganese (Menon et al., 2021). The regulatory context is neither alarmist nor nothing: the European Food Safety Authority set a reference point of 0.06 µg/kg body weight per day for inorganic arsenic and concluded that consumer exposure in food "raises a health concern," with margins of exposure of 2.0 to 0.4 for average consumers and 0.9 to 0.2 for high consumers (EFSA CONTAM Panel, 2024). For a household eating rice twice a day this warrants a technique rather than anxiety: rinse until the water runs clear, cook in generous water, drain.
There is a real cost, measured in the same study. Draining white rice that way took 22% of its magnesium and 48% of its potassium, along with the water-soluble B vitamins parboiling worked to move inward. That trade argues for unpolished parboiled rice as the base, because it starts with more to lose.
What draining does not do is turn high-glycaemic rice into low-glycaemic rice; postprandial variation is driven by amylose, parboiling intensity and cooking time, not rinsing (Boers et al., 2015). Nor is there a verified figure for how much energy the discarded water carries — the starch that matters is inside the gelatinised grain, and what leaches out is surface starch. This book will not publish a number it cannot source. As for drinking the kanji vellam: it carries leached potassium and B vitamins, and it is a real part of Kerala's food culture with genuine value in convalescence, but there is no clinical trial of drinking it. Culturally valid, nutritionally modest. Cadmium is the other metal readers ask about, and this book has no verified source.
The Kerala trial, and the only measured glycaemic indices you will be shown
Almost everything above comes from somewhere else: Chennai, Jakarta, Poznań, 21 countries. One randomised intervention tested actual Kerala recipes in Kerala, measured their glycaemic indices, and followed clinical outcomes for 24 weeks (Pavithran et al., 2020). It is the most directly relevant evidence in this book.
The measured values: red rice puttu 38, Rose Matta rice 38, broken-wheat upma 41, whole-wheat puttu 45, whole-wheat roti 45, oats puttu 51–52. In the arm eating South Indian food built from low-glycaemic-index ingredients, over 24 weeks, HbA1c fell by 0.93 percentage points, fasting glucose by 21 mg/dL, postprandial glucose by 37.87 mg/dL, HOMA-IR by 6.51 and weight by 1.87 kg, with reductions in triglycerides, high-sensitivity CRP and apolipoprotein B.
Sit with what that says. Matta rice and red rice puttu measured as low-glycaemic foods — not tolerable, not permitted, low. And a 0.93 percentage-point HbA1c change is larger than anything any spice in this book achieves, larger than the 0.3 to 0.5 typical of low-glycaemic eating generally, achieved by feeding people the food of their own state.
Two cautions, because foregrounding a study is not inflating it. Those glycaemic index values were determined within this trial rather than replicated across laboratories, and 38 for a rice sits at the very low end of published rice determinations; the parboiled brown grain in Shobana's Indian series measured 57.6. Variety, milling, cooking method and testing protocol all plausibly explain a gap that size. And an arm eating a whole redesigned cuisine changed many things at once, so the 0.93 belongs to the pattern, not to matta rice alone. Neither caution touches the practical conclusion: a Kerala plate built on unpolished parboiled and red rice, with pulses and vegetables, measured low and performed well in Kerala.
Portion, polish, pulse, plate
Four words, in order of effect size.
Portion first, because it is the largest and least popular. PURE's gradient is a gradient in cooked grams, and glycaemic-load arithmetic says the same from the other side: at 78.2 g of available carbohydrate per 100 g of raw milled rice (Longvah et al., 2017) and a glycaemic index of 73, a 100 g dry portion — about 260 g cooked, a little under two cups — carries a glycaemic load of roughly 57, while a 40 g dry portion carries about 23. That is arithmetic rather than a published finding, and it is the whole argument: the same rice, at 40% of the quantity, is a different metabolic event.
The quarter of the plate this book allots to grain or tuber means 125 to 150 g of cooked rice at a meal, which is 48 to 58 g dry. Two rice meals a day at that size puts you at 250 to 300 g cooked, inside PURE's middle bands rather than its highest. A reader doing physical work can carry 200 g without apology. A reader whose waist and HbA1c are both moving the wrong way should sit at 125 g and put the space on the plate to work.
Weigh it once; that is the whole training. Serve yourself rice as you normally would, weigh it, and look at the number; then weigh out 150 g and look at that. For most readers the first number is two to three times the second, and the discovery is unwelcome and permanent. Then calibrate a utensil: fill your own thavi or serving spoon, weigh what it holds, and from that day you can serve by eye. A 200 ml cup of cooked rice is about 150 g, the conversion PURE itself used.
Polish second, because it is a one-time purchasing decision that then asks nothing of you: unpolished or minimally milled parboiled matta or red rice, every time, on the strength of 57.6 against 79.6 (Shobana et al., 2017) and 38 in a Kerala kitchen (Pavithran et al., 2020). Accept the longer cooking and the coarser texture; both are what rice used to be.
Pulse third: 50 g cooked, minimum, on every plate carrying rice (Mohan et al., 2014). Not a garnish. A ladle.
Plate fourth, the frame the other three sit inside. Half the plate vegetables, a quarter protein, a quarter grain, acid somewhere on it, fat measured rather than poured. Rice eaten off that plate behaves differently from rice eaten off a plate that is nine-tenths rice with a curry over the top, and no amount of choosing the right variety compensates for the second arrangement.
That is the answer to the rice question. Not abstinence. Portion, polish, pulse, plate — and the rice chapter that follows (R015–R023) is a set of instructions for making all four taste like home.
Chapter 8 — The Coconut Question
Confident people have told you opposite things about coconut oil, and both sounded certain. One said it is nearly 90% saturated fat and therefore the worst thing in the Kerala kitchen. The other said it is a medium-chain triglyceride, metabolised differently from other fats, thermogenic, and the reason Kerala's grandmothers reached ninety. Neither camp usually cites a number. Both are describing a substance whose composition has been measured repeatedly, to two decimal places, by two independent national food-composition programmes — which means most of this argument can be settled before a single clinical trial is opened.
The composition, which does most of the work
Coconut oil, sampled across six Indian regions, is 90.86% saturated fatty acids, 7.24% monounsaturated and 1.90% polyunsaturated. Within the saturated fraction, lauric acid (C12:0) is 49.57%, myristic 21.12%, palmitic 9.26% and stearic 2.97%. The genuinely medium-chain fatty acids, caprylic (C8:0) and capric (C10:0), are 2.76% and 5.18% (Longvah et al., ICMR-NIN Indian Food Composition Tables, 2017). The United States reference entry agrees on the shape of the thing: per 100 g, 892 kcal (3,732 kJ), 99.1 g fat, 82.5 g total saturated fat, 41.8 g lauric acid, 6.8 g caprylic and 5.39 g capric (USDA FoodData Central, SR Legacy 171412).
Read them together and one conclusion is unavoidable arithmetic. True medium-chain fatty acids, C8 plus C10, are about 8% of coconut oil. The other 92% is something else, and half of it is one molecule.
Why the MCT framing collapses
The marketing case rests on counting lauric acid as a medium-chain triglyceride. By carbon number that is arguable; C12 sits exactly at the boundary, and textbooks draw the line on different sides of it. But the reason anyone cares about medium-chain fats is a physiological claim, not a naming one: that they are absorbed into the portal circulation, delivered to the liver and oxidised rather than packaged and stored. Lauric acid does not behave that way to any useful extent. It is largely absorbed and transported like a long-chain fat, which is why coconut oil does not produce the effects that purpose-made C8/C10 MCT oil produces.
Precision matters more than emphasis here. The physiological literature on how lauric acid partitions between the portal route and chylomicrons exists, and this book will not publish a percentage it has not read at source. What needs no hedging is the compositional statement — 8% C8 plus C10 — and its consequence: coconut oil is not, in any useful sense, an MCT oil, and studies of MCT oil cannot be read across to it. Reviews arguing the pro-coconut case on chain-length grounds exist and are worth reading as positions, not as evidence (Hewlings, 2020). There is also a more decisive way to settle it, which is to stop arguing about absorption routes and look at what happens to people.
What the trials found
Sixteen clinical trials of at least two weeks were pooled, comparing coconut oil with non-tropical vegetable oils (Neelakantan et al., 2020). Coconut oil raised LDL cholesterol by 10.47 mg/dL (95% CI 3.01–17.94), total cholesterol by 14.69 mg/dL (4.84–24.53) and HDL cholesterol by 4.00 mg/dL (2.26–5.73). Triglycerides did not change significantly. On the outcomes the popular literature promises loudest, there was nothing: body weight −0.23 kg (−0.82 to 0.36), fasting glucose +0.12 mmol/L (−0.11 to 0.35), C-reactive protein −0.001 mg/L (−0.85 to 0.85) — no benefit to glycaemia, inflammation, body weight or body fat. The effects persisted after excluding non-randomised and lower-quality trials. Against palm oil the gaps were larger still, total cholesterol +25.57 and LDL +20.50 mg/dL. The authors' conclusion is one sentence: coconut oil consumption results in significantly higher LDL cholesterol than non-tropical vegetable oils, and this should inform choices about coconut oil consumption.
Heterogeneity was high in the lipid analyses, I² of 84% for LDL and 72% for HDL, so the trials disagreed about magnitude. They did not disagree about direction.
The trial that complicates it, included rather than buried
Ninety-four adults aged 50 to 75 were randomised to 50 g a day of extra-virgin coconut oil, extra-virgin olive oil, or unsalted butter for four weeks (Khaw et al., 2018). Butter raised LDL cholesterol significantly against coconut oil (+0.42 mmol/L, 95% CI 0.19–0.65, P < 0.0001) and against olive oil (+0.38, P < 0.0001). Between coconut oil and olive oil there was no difference in LDL (−0.04 mmol/L, −0.27 to 0.19, P = 0.74). Coconut oil raised HDL against both. There were no differences in weight, BMI, waist, body fat, glucose or blood pressure.
That is a well-conducted randomised trial disagreeing with the pooled estimate, so it must be characterised rather than waved away. It ran four weeks, short for a lipid endpoint. It enrolled healthy volunteers with a mean age around sixty, whose baseline lipids and dietary background differ from a middle-aged South Asian population with a family history of coronary disease. It used a fixed 50 g a day of a single oil, which is not how anyone cooks. And it was one trial against sixteen. Its own authors wrote that the findings do not alter current dietary recommendations to reduce saturated fat intake in general — which is also the direction of the wider evidence, where reducing saturated fat cut combined cardiovascular events by 17% across 15 randomised trials in 56,675 people (Hooper et al., 2020), and where the World Health Organization recommends reducing saturated fat to 10% of energy and replacing it with polyunsaturated fat (WHO, 2023).
The honest position is neither of the two confident ones. The LDL-raising signal is consistent in meta-analysis and inconsistent in one good short trial. The HDL rise is consistent. No trial has tested coconut oil against a heart-attack or stroke endpoint, so the net cardiovascular effect is inferred from the lipid change rather than measured.
What Eyres actually said, and why the sentence matters
The most quotable line in this literature comes from a review of 21 papers, eight of them clinical trials, which found coconut oil generally raised total and LDL cholesterol more than cis-unsaturated plant oils but less than butter (Eyres et al., 2016). The line: observational evidence suggests that consumption of coconut flesh or squeezed coconut in the context of traditional dietary patterns does not lead to adverse cardiovascular outcomes; however, due to large differences in dietary and lifestyle patterns, these findings cannot be applied to a typical Western diet.
Both halves are load-bearing, and the second is the one that gets dropped. Three things separate a traditional coconut-eating pattern from a modern one. Form: those populations ate coconut flesh and squeezed milk, not a bottle of extracted oil. Dose: extraction concentrates the fat and removes every satiety brake that came with it, so it is trivial to eat 40 g of coconut oil in a day and almost impossible to eat the 100 g of flesh that would carry it. Everything else in the diet: tubers, fish, greens, no refined flour, no sweetened drinks, and a great deal of physical work. A study of people eating coconut inside that pattern cannot tell you what coconut oil does inside a pattern of parotta, packaged snacks, sweet tea and a desk.
The uncomfortable part is that the caveat applies as forcefully to the modern Kerala diet as to a Western one. The pattern that made coconut harmless is the pattern this book is trying to rebuild.
The pivot: coconut flesh is not coconut oil
Here is the fact the chapter turns on. Per 100 g, fresh coconut kernel carries 10.42 g of total dietary fibre — 9.43 g insoluble, 0.99 g soluble — 3.84 g of protein, 41.38 g of fat, 6.30 g of available carbohydrate and 1,711 kJ (409 kcal) (Longvah et al., 2017). Dry kernel carries 15.88 g fibre and 7.27 g protein. The USDA entry for raw coconut meat agrees closely at 9.0 g fibre and 3.33 g protein.
Coconut oil carries zero fibre, zero protein and 99 g of fat.
That is not a subtle distinction between two versions of one food. It is the difference between a fruit and an extract. The fibre is why grated coconut in a thoran sits differently in the stomach from the same fat poured from a bottle; the protein is small but real; intact cell walls slow the release of the fat itself. One moderate trial compared coconut forms head to head — 190 Sri Lankan adults took coconut oil 30 ml, kernel flakes 30 g, coconut milk powder 30 g, or nothing, for eight weeks, and the milk-powder group lowered LDL and non-HDL and raised HDL while oil and flakes did not (Ekanayaka et al., 2024) — but do not lean on it: unblinded, single-country, a no-treatment control rather than an isocaloric comparator, and milk powder rather than fresh milk.
Put the composition data and Eyres's caveat together and the defensible position is narrow. Whole coconut in traditional quantities inside a traditional pattern has not been shown to be harmful. Extracted coconut oil raises LDL cholesterol relative to seed and nut oils. The assumption that the flesh is actively protective is plausible and unestablished.
So this book keeps the grated coconut and the coconut milk, and changes the frying oil. Not because coconut is virtuous and oil is wicked, but because the fibre and protein are in one and not the other, and because the volume of fat a household eats is almost entirely a function of what it fries in, not what it grinds into a thoran.
Coconut milk, the three extractions, and the technique that changes everything
Coconut milk is not a dairy analogue; it is an emulsion of coconut fat in water, held together by the kernel's own proteins and phospholipids at the oil–water interface. Kerala's kitchen grammar recognises three grades. The first press, onnaam paal, is thick and almost cream-like, taken from grated kernel with very little water. The second, randaam paal, comes from the same flesh with more water. The third, moonnaam paal, is thin and used as cooking liquid.
The rule that follows from the emulsion chemistry is the most important technique in the Kerala repertoire, and it is why a curry splits: thick first-press milk must never be brought to the boil. At boiling temperature the interfacial proteins denature and lose the ability to keep fat droplets apart; the droplets coalesce, the emulsion breaks, and fat rises out as a film over a grainy body. So the thin third extract goes in early and simmers, the second extract mid-cook, and the first press at the end, off the heat or over the barest flame, warmed through and never boiled. Chapter 14 gives the technique in full; every coconut-milk curry in Part Three is built on it.
Here is the part that belongs in a metabolic-health book rather than a technique manual. That rule is also a fat-reduction tool. A curry finished with thick milk off the heat delivers its coconut flavour at full strength, because no volatile aromatics have been boiled off and no fat has been driven out of emulsion into a slick on top. A curry that has had thick milk boiled into it for fifteen minutes tastes flatter and greasier at once, so the cook compensates with more milk. Adding the coconut milk last means you need less of it. The same principle governs the oil: half a teaspoon of coconut oil stirred in off the heat is perceived far more strongly than the same half-teaspoon cooked in from the start, which makes late addition the highest-leverage oil-reduction trick in this book.
Virgin coconut oil: what survives scrutiny
Precisely one claim survives. The only virgin-coconut-oil-specific randomised trial available used extra-virgin coconut oil and found LDL cholesterol comparable to extra-virgin olive oil over four weeks (Khaw et al., 2018), with no benefit to weight, waist, body fat, glucose or blood pressure. Cold-pressed unrefined coconut oil also tastes better and keeps more of its aroma compounds, which is what a thoran or a fish curry actually wants. That is a culinary argument, and a good one.
What does not survive: any claim that virgin coconut oil aids weight loss, raises metabolic rate, reduces abdominal fat, improves insulin sensitivity or protects the heart. The pooled evidence found no effect on body weight (−0.23 kg, not significant), body fat percentage, waist circumference, fasting glucose or CRP (Neelakantan et al., 2020). "Virgin" describes an extraction method. It does not change that the product is 91% saturated fat.
The oil decision, in a table and then in prose
The comparison that matters is fatty-acid composition, and these figures come from one source and one method, so they are directly comparable (Longvah et al., 2017, as percentages of total fatty acids).
| Oil | SFA % | MUFA % | PUFA % | Approximate smoke point | Where it belongs |
|---|---|---|---|---|---|
| Coconut (velichenna) | 90.9 | 7.2 | 1.9 | ~175–200°C unrefined; ~230°C refined | Measured teaspoons, where it is the flavour: tempering, finished thoran, a fish curry's last aroma, achar |
| Gingelly / sesame | 16.3 | 41.4 | 42.3 | ~175°C unrefined; ~210–230°C refined | Volume work; sautéing the masala base |
| Groundnut | 18.9 | 53.9 | 27.2 | ~225–230°C | Shallow-frying fish; anything holding high heat |
| Rice bran | 23.8 | 44.1 | 32.1 | ~230–250°C | The default frying oil: neutral, high smoke point, sold everywhere in Kerala |
| Corn | 16.6 | 33.7 | 49.7 | — | Acceptable stand-in for sesame in diaspora kitchens |
| Mustard | 5.7 | 67.1 | 27.2 | ~175–190°C unrefined | Flagged, not recommended freely: 51.3% erucic acid |
| Palm | 45.0 | 43.5 | 11.5 | — | Avoid |
Smoke-point figures deserve a caveat rather than confidence. Published values vary widely between sources, depend heavily on refining level and free fatty acid content, and change as soon as an oil has been used. Smoke point is also a poor proxy for oxidative stability, since oils high in polyunsaturates can oxidise well below the temperature at which they visibly smoke. Treat that column as indicative, not as data.
The prose version is simpler. Coconut oil stays where it is the flavour, and it is measured in teaspoons. A thoran finished off the heat, a meen vevichathu given its closing aroma, a tempering of mustard seed and curry leaf, an achar: in each of those the oil does work no other fat can do, and 5 to 10 g does it. Take coconut oil out of a Kerala thoran and you have a stir-fried vegetable from somewhere else.
Sesame, groundnut or rice bran takes over for volume work — the oil that softens onions for twenty minutes, the oil a fish is shallow-fried in, the oil a masala base is built on. That is where the tablespoons live, and moving those tablespoons from 91% saturated fat to 16–24% is precisely the substitution WHO describes: saturated fat replaced by polyunsaturated fat. It needs no new skill and no reduction in the amount of cooking. Note one asymmetry: WHO's strong recommendation is specifically for replacement with polyunsaturated fat, while plant monounsaturated fat is only conditional, which is a small point in sesame's favour over groundnut.
On reuse the guidance is short and not aesthetic. Repeated heating drives lipid oxidation and generates polar compounds, aldehydes, polymers and trans isomers, and prolonged consumption of repeatedly heated oil has been shown to raise blood pressure and total cholesterol, cause vascular inflammation and produce vascular changes predisposing to atherosclerosis — though much of that evidence is from animal models and no large human outcome trial exists (Ng et al., 2014). ICMR-NIN's 2024 guidance advises Indians to avoid reheating and reusing left-over heated oils. In practice: do not reuse frying oil more than once; discard oil that has darkened, thickened, foams or smells acrid; never top up old oil with fresh, because the old oil's breakdown products accelerate the new; and fry in a small, narrow, heavy pan so there is less oil to feel guilty about discarding. Frying at too low a temperature raises how much oil the food absorbs, so hotter and briefer is both better cooking and less fat.
What changed, and what did not Nothing here removes coconut from Kerala cooking. Grated coconut stays — in the thoran, the avial, the chammanthi — with its 10 g of fibre per 100 g. Coconut milk stays, in the olan and the stew and the mappas, added at the end and never boiled. Two things change: the oil that volume-fries becomes sesame, groundnut or rice bran, and the coconut oil that remains is measured with a spoon.
Keep the coconut. Measure the oil. Change the frying fat. That is the chapter, and it costs a household one extra bottle on the shelf and one teaspoon in the drawer.
Chapter 9 — Spices: What Is True, What Is Sold to You
A health cookbook that dismantles the most profitable claims of its own genre is doing something deliberate, and the reason should be said out loud. This chapter will tell you that turmeric does not lower your cholesterol, that cinnamon does not control blood glucose, that curry leaves carry no metabolic claim worth making, and that chilli's contribution to fat loss amounts to about the energy in a teaspoon of oil a day. Every one of those claims is currently sold in capsule form at a margin. Taking them apart is the price of being believed about what this book does claim: the pulse on every plate, the portion of rice, the oil in the pan, the salt in the shaker.
Two structural facts frame what follows. This literature is dominated by small, short, single-centre trials with high heterogeneity, frequent publication bias, and, in the curcumin literature, recurring authorship by employees of supplement manufacturers; one umbrella review found that all 14 systematic reviews of turmeric and glucose metabolism it appraised rated critically low on the AMSTAR-2 instrument (Pathomwichaiwat et al., 2023). And almost every headline of the form "spice X lowers HbA1c" rests on capsules of extract rather than the quantity of spice in a curry, with one to two orders of magnitude between the two.
Culinary dose versus trial dose
"Dose used in trials" is the range at which the cited syntheses found effects. "Realistic amount per serving" is estimated from ordinary Kerala practice, typical quantity per dish divided by four servings, and these are estimates for scale comparison, not measured literature values.
| Spice | Dose used in trials | Realistic amount per serving | Verdict |
|---|---|---|---|
| Garlic (velluthulli) | 600–2,400 mg/day powder or 1.2–2.4 g/day aged extract ≈ 1–4 cloves | 1–2 cloves, 3–6 g fresh | Meaningful at culinary doses |
| Fenugreek (uluva) | 5–25 g/day seed; only medium or high doses worked | 0.2–0.5 g as seasoning | Only at supplement doses as normally cooked; reachable through food at 10–25 g/day as soaked seed, sprouts, methi leaves or batter |
| Ginger (inchi) | 1.6–4 g/day dried for HbA1c; ≥3 g/day for BP | 2–5 g fresh ≈ 0.4–1 g dried | Borderline; achievable with effort for HbA1c and nausea; only at supplement doses for BP |
| Turmeric (manjal) | 1–2 g/day curcuminoids or enhanced extract | 0.5–1 g powder ≈ 15–30 mg curcuminoids | Only at supplement doses — which carry a documented liver-injury signal |
| Cinnamon, cassia | 1–6 g/day, mean 2 g/day | 0.2–0.5 g | Insufficient evidence; trial doses breach the coumarin tolerable daily intake |
| Cinnamon, Ceylon (C. verum) | Not separately established | 0.2–0.5 g | Insufficient evidence for benefit; very low coumarin, so liberal use is safe |
| Black pepper (kurumulaku) | 20 mg piperine, for curcumin bioavailability | 0.2–0.5 g ≈ 6–45 mg piperine | Meaningful at culinary doses for bioavailability only |
| Chilli (mulaku) | Capsaicinoid supplements; +34 kcal/day | 1–3 g fresh or 0.5–2 g dried | Meaningful but clinically trivial for weight; meaningful for salt reduction |
| Curry leaves (kariveppila) | 12 g/day powder — transient effect only | 5–15 leaves, 1–3 g fresh | Insufficient evidence at any dose |
| Cardamom (elakka) | 3 g/day | 2–4 pods, 0.2–0.5 g | Insufficient evidence |
| Cumin (jeerakam) | None identified | 0.2–0.5 g | Insufficient evidence |
| Coriander (mallii) | None identified | Culinary | Insufficient evidence |
| Fennel (perumjeerakam) | None identified | Culinary | Insufficient evidence |
| Cloves | None identified | 0.1–0.5 g | Insufficient evidence |
| Nutmeg (jathikka) | No efficacy trials; toxic at ~5 g single dose | 0.05–0.2 g, a scrape | Safe as a spice, hazardous by the teaspoon |
| Asafoetida (kayam) | None identified | A pinch | Insufficient evidence |
| Kudampuli / Garcinia | 1,000–1,500 mg/day hydroxycitric acid, for −0.88 kg | 1–3 g dried rind per dish | Only at supplement doses — and the supplement should be avoided. The culinary rind is not implicated in liver injury |
Three entries read "meaningful at culinary doses" for something metabolic: garlic, fenugreek if you go out of your way, and ginger at the edge of plausibility.
Garlic: the one spice whose dose overlaps your cooking
The largest synthesis available pooled 108 trials in 7,137 participants: systolic blood pressure −3.71 mmHg (95% CI −5.07 to −2.36), diastolic −1.97 mmHg (−2.86 to −1.08), total cholesterol −10.21 mg/dL, LDL cholesterol −5.90 mg/dL, triglycerides −5.82 mg/dL, HDL +2.18 mg/dL, fasting glucose −2.77 mg/dL, CRP −1.6 mg/L, and no effect on body weight or BMI, with larger effects where baseline risk was worse (Behrouz et al., 2026). Trial doses cluster at 600 to 2,400 mg a day of standardised powder or 1.2 to 2.4 g of aged extract, roughly one to four fresh cloves. That is dinner.
There is a more flattering number, and the reason this book does not quote it is itself the lesson. A widely cited meta-analysis of 12 trials in 553 hypertensive participants reported systolic blood pressure down 8.3 ± 1.9 mmHg and described this as working similarly to standard antihypertensive medication (Ried, 2020). That review is single-authored by a researcher whose garlic work has been closely associated with a commercial aged-garlic-extract product, and the framing is stronger than the underlying trials support.
So: 12 trials say −8.3 mmHg and 108 trials say −3.7 mmHg. Quote the 108. Not because the smaller review is fraudulent, but because larger syntheses absorb the null studies alongside the positive ones, and regression toward a smaller effect as evidence accumulates is the normal life cycle of a true finding. Learning to prefer the bigger, less flattering synthesis will serve you on every food claim you meet from here on, and it costs little: −4/−2 mmHg and −6 mg/dL of LDL is real and worth having. It is an adjunct, not a substitute for a tablet, and nobody should stop an antihypertensive because they have started cooking with more garlic.
One kitchen note with a real mechanism. Allicin is not present in intact garlic; it forms when alliin meets alliinase on crushing, and it is heat-labile. Crush the garlic and let it stand about 10 minutes before it goes into hot oil. That is mechanistically sound, though no outcome trial shows it changes anything clinical. Garlic also has a genuine antiplatelet effect: anyone on warfarin or an antiplatelet drug, or facing surgery, should mention gram-level garlic supplements to their clinician.
Fenugreek: the one case reachable through food
Fenugreek has the strongest glycaemic evidence of any spice here, by a wide margin. Across 10 trials it lowered fasting glucose by 0.96 mmol/L (95% CI −1.52 to −0.40), two-hour post-load glucose by 2.19 mmol/L (−3.19 to −1.19) and HbA1c by 0.85 percentage points (−1.49 to −0.22) — with effects found only where medium or high doses were given to people with diabetes, and with most trials of low methodological quality (Neelakantan et al., 2014). An updated synthesis of 26 randomised trials gave fasting glucose −16.75 mg/dL (−23.36 to −10.15) and HbA1c −0.63 percentage points (−0.76 to −0.51), with heterogeneity reaching I² of 95.1% (Chehregosha et al., 2025). A third, in 10 trials and 706 participants, found significant reductions in fasting and two-hour glucose and HbA1c, no change in LDL or body weight, and no toxicity beyond mild gastrointestinal effects (Kim et al., 2023).
An HbA1c reduction of 0.63 to 0.85 percentage points is clinically meaningful if the dose is reached, and the dose is 10 to 25 g of seed a day. Here the honesty has to come in. A Kerala fish curry contains perhaps a quarter-teaspoon of fenugreek, about 1 g, divided among four people. At normal seasoning quantities fenugreek does nothing measurable; the ratio of trial dose to culinary dose is between 20 and 100 to one. What makes fenugreek unique is that the gap is bridgeable with food rather than capsules: a tablespoon of seeds soaked overnight and eaten swollen, methi leaves cooked as a green in volume, a deliberately fenugreek-heavy dosa batter, sprouted seeds in a salad. If you soak the seeds, eat them rather than drinking the water and discarding them, because the mechanism is in the seed: fenugreek is roughly 45 to 50% fibre, about half of that soluble galactomannan, which raises the viscosity of gut contents and slows gastric emptying and glucose absorption. That is a bulk physical mechanism. It needs grams, and it survives cooking.
This is the one place in this book where "talk to your doctor first" is not boilerplate, and it needs its own paragraph. Fenugreek at 10 to 25 g a day genuinely lowers blood glucose. If you take insulin, or a sulfonylurea such as glimepiride, gliclazide or glibenclamide, adding that much fenugreek can produce hypoglycaemia, because your dose was calculated for a diet that did not contain it. That is not a theoretical interaction; it is the predictable consequence of the effect the trials measured. Tell the clinician who prescribes your medication before you start, expect to monitor your glucose more often for the first few weeks, and do not adjust any dose yourself.
One more caution. Fenugreek has traditional uterine-stimulant use and is conventionally avoided at therapeutic doses in pregnancy. Culinary quantities are customary and a different exposure entirely, but gram-level doses during pregnancy need obstetric advice.
Ginger: borderline, and useful for a reason nobody advertises
Across eight randomised trials in 454 people with type 2 diabetes at 1,600 to 4,000 mg a day of dried ginger, HbA1c significantly improved while fasting glucose did not change significantly (Huang et al., 2019). For blood pressure, six trials in 345 participants gave systolic −6.36 mmHg, but with I² of 89.8% and significance only in subgroups defined by age under 50, follow-up of eight weeks or less, and doses of 3 g a day or more (Hasani et al., 2019). A −6 mmHg estimate with 90% heterogeneity from six small trials is not a foundation for a claim, and this book makes none.
The HbA1c signal at 1.6 to 4 g a day is the interesting one, because it is nearly reachable. Fresh ginger is about 80% water, so 3 g of dried powder is something like 15 to 20 g of fresh. A genuinely ginger-heavy Kerala diet — inji puli, ginger in the sambharam, ginger ground into the masala — can get there, but only just, and only deliberately.
Ginger's best-established human effect is not metabolic: across 14 randomised trials in 1,506 surgical patients it reduced postoperative nausea scores at two, six and 12 hours, though without significant effect on vomiting or rescue antiemetic use (Lu et al., 2022). That is useful here, because readers starting metformin or a GLP-1 receptor agonist often feel sick for the first few weeks. Like garlic, ginger has in vitro antiplatelet activity, and gram-level supplements, particularly around surgery, should be mentioned to a clinician.
Turmeric: the food is fine, the capsule is a different product
Culinary turmeric delivers roughly 15 to 30 mg of curcuminoids per serving. Trials that found effects used 1 to 2 g a day of curcuminoids or bioavailability-enhanced extract. The ratio is 30 to 70 times, and nothing about the curry closes it.
Even at trial doses the effects are smaller than the marketing. A dose–response meta-analysis of 34 randomised trials in prediabetes and type 2 diabetes found HbA1c −0.32 percentage points (95% CI −0.43 to −0.21) (Bahari et al., 2026), while an umbrella review with an updated meta-analysis of 28 trials found HbA1c −0.134 percentage points, with I² of 75.8% and 83.0% and certainty downgraded for inconsistency (Pathomwichaiwat et al., 2023). Metformin monotherapy, for context, lowers HbA1c by 1.0 to 1.5 percentage points. On lipids the picture is worse for the claim most often made: pooling 20 trials in 1,427 people, curcuminoids lowered triglycerides by 21.36 mg/dL and raised HDL by 1.42 mg/dL, while LDL cholesterol was not significantly changed (−5.82 mg/dL, P = 0.253) (Simental-Mendía et al., 2019) — an analysis carrying an author affiliated with a supplement manufacturer, which makes the null LDL result more striking rather than less. Do not tell a reader with raised LDL cholesterol that turmeric will lower it.
Then the safety story, which almost no reader has been told. The United States LiverTox database assigns turmeric a likelihood score of A — recently established as a well-documented cause of clinically apparent liver injury. The pivotal case series adjudicated ten cases from the Drug-Induced Liver Injury Network: eight of ten were women, median age 56, injury hepatocellular in nine of ten, five hospitalised, and one died of acute liver failure, with latency of one to four months. Three of the seven products chemically analysed also contained piperine, and seven of the ten patients carried HLA-B*35:01, at an allele frequency of 0.450 against 0.056 to 0.069 in controls, pointing to an immune-mediated idiosyncratic mechanism (Halegoua-DeMarzio et al., 2023). The exposure in every case was a concentrated supplement, in several a bioavailability-enhanced formulation containing piperine; LiverTox states that standard turmeric powder has a long history of safety. So the position here is the opposite of most wellness writing: turmeric in your curry is fine, safe and delicious; high-dose turmeric-plus-piperine capsules are a different product with a different risk profile, one in which a death has been recorded. Since those at risk cannot be identified in advance without genotyping, the sensible rule is that new fatigue, nausea, dark urine or yellowing of the eyes after starting such a supplement means stopping it and seeing a doctor that week.
The "+2000% bioavailability" line deserves naming precisely, because it powers the whole product category. It rests on a single small pharmacokinetic study published in 1998, in which 2 g of curcumin alone produced serum levels that were undetectable or very low in humans and adding 20 mg of piperine raised bioavailability by 2,000% — across a window of 15 minutes to one hour, in healthy volunteers, with no clinical outcome measured (Shoba et al., 1998). The author list includes the founder of the corporation that markets the standardised piperine product, and the same author appears on the curcuminoid lipid meta-analysis above. That does not make the pharmacokinetics wrong. It does mean the figure must never be presented as a neutral, replicated finding — and the folklore that most reliably sells capsules is also the co-formulation implicated in turmeric-associated liver injury. Something quieter can be said instead: 20 mg of piperine is about 0.06 to 0.1 g of black pepper, and Kerala cooking has always put turmeric, pepper and a fat in one pan. Traditional practice that happens to align with pharmacology is a much weaker and more honest claim than anything on a label.
One supply-chain matter remains. Lead chromate adulteration of turmeric is real and quantified: of 356 samples from 23 cities across India, Pakistan, Sri Lanka and Nepal, 14% carried lead above 2 µg/g, with lead above 1,000 µg/g in Patna, Karachi and Peshawar (Forsyth et al., 2024). Buy whole dried rhizome and grind it where you can, or buy brands that publish heavy-metal testing, and be suspicious of unnaturally bright, uniform yellow-orange powder.
Cinnamon: two syntheses that agree by disagreeing
The Cochrane review covered 10 randomised trials in 577 people with type 1 or type 2 diabetes, mostly Cinnamomum cassia, at a mean 2 g a day for four to 16 weeks. The effect on fasting glucose was inconclusive and there was no significant difference for HbA1c, serum insulin or postprandial glucose; the conclusion was insufficient evidence to support the use of cinnamon for type 1 or type 2 diabetes mellitus (Leach and Kumar, 2012). The best-known positive meta-analysis, six trials in 435 patients at 1 to 6 g a day, reported HbA1c −0.09 percentage points (Akilen et al., 2012). Put those side by side: the systematic review found nothing reliable, and the positive analysis found nine hundredths of a percentage point. The heterogeneity is easy to account for — different species pooled together, bark powder against aqueous against proprietary extract, doses spanning sixfold, durations shorter than a full HbA1c turnover.
The species question is where Kerala has something useful to say. Cinnamomum verum, true or Ceylon cinnamon, is native to this corner of the world; most supermarket cinnamon is C. cassia or C. burmannii. The distinction matters for one reason: coumarin, hepatotoxic in susceptible people. Cassia is high in it; Ceylon has, in one analytical paper's phrase, an ultra-low content, and the price premium makes Ceylon a common target of adulteration with cassia, so the label alone is not a guarantee (Pages-Rebull et al., 2024). Germany's Federal Institute for Risk Assessment applies a coumarin tolerable daily intake of 0.1 mg per kg body weight per day, reached by a 60 kg adult at roughly 2 g of cassia cinnamon a day, about three-quarters of a teaspoon. So the doses used in the glycaemia trials, 1 to 6 g a day and mostly cassia, routinely exceed that limit: recommending a daily teaspoon of ordinary cinnamon "for blood sugar" is recommending chronic coumarin intake above the tolerable daily intake in exchange for an effect Cochrane could not find. If you want cinnamon often, buy Ceylon, use it as a flavour, and expect nothing of it metabolically — a happy conclusion in a Kerala book, since Ceylon is the local species.
Curry leaves: magnificent, and making no claims
The most-cited human study gave 30 people with non-insulin-dependent diabetes 12 g a day of curry leaf powder, delivering 2.5 g of fibre, for one month. The result was a transient fall in fasting and postprandial glucose at 15 days, and no appreciable change in glycosylated serum proteins, the glycosylated LDL fraction, serum lipids or lipoprotein cholesterol at either 15 or 30 days (Iyer and Mani, 1990). That is a negative study for durable benefit, and it remains the most substantial human curry-leaf trial in existence. Everything else is rodent or in vitro work, much of it in alloxan- and streptozotocin-induced models, which are chemically induced beta-cell destruction and poor predictors of human type 2 diabetes. Note the dose ratio too: five to 15 leaves, a generous amount in a real thoran or tempering, is about 1 to 3 g fresh, roughly a tenth of the 12 g of powder that produced only a transient effect.
So there is no credible basis for claiming curry leaves control blood glucose, lower cholesterol or assist weight loss. What they are is a mineral-dense aromatic leaf of extraordinary flavour, and the most useful instruction this book can give about them is not metabolic: eat them, do not pick them out.
Chilli: the number, and what chilli is actually for
Capsaicinoids and capsinoids raised resting metabolic rate by 33.99 kcal a day (95% CI 15.95–52.03, I² = 0%), lowered respiratory quotient by 0.01 and increased fat oxidation across 13 studies (Irandoost et al., 2021). That is a clean, homogeneous, believable finding, and quantifying it is the fastest way to see that it is not a weight-loss strategy. Thirty-four kilocalories a day is the energy in about 4 g of fat, less than a teaspoon of oil; sustained perfectly for a year with zero compensatory eating it corresponds to roughly 1.3 kg of fat, and appetite does not permit zero compensation. The leading critical review says the same in its authors' words: capsaicin augments energy expenditure and suppresses appetite-driving sensations, but the magnitude of these effects is small (Ludy et al., 2012). Large cohorts do associate frequent chilli eating with lower mortality, at a hazard ratio of 0.77 (95% CI 0.66–0.90) in 22,811 Italian adults (Bonaccio et al., 2019), but those are observational and confounded by everything that travels with eating home-cooked, vegetable-rich food.
Chilli's real value here lies elsewhere and it is substantial. Capsaicin's trigeminal stimulation raises perceived flavour intensity and the palatability of low-salt food, which makes chilli one of the most effective salt-reduction tools a cook has — and salt reduction, unlike thermogenesis, moves blood pressure measurably (Chapter 10). One correction while we are here: chilli does not cause ulcers, though it does aggravate symptoms in functional dyspepsia, reflux and irritable bowel syndrome. If it hurts, eat less of it.
Black pepper: real in a laboratory, irrelevant in a curry
Piperine genuinely inhibits intestinal and hepatic glucuronidation and P-glycoprotein, and the bioavailability-enhancing effect is established in principle (Shoba et al., 1998), with the funding caveat noted. Two things follow. It is a pharmacokinetic effect and it cuts both ways, so anyone taking piperine supplements alongside a narrow-therapeutic-index medicine should discuss it with a pharmacist; culinary pepper is not a realistic concern in either direction. And the enhancement is not automatically a benefit, given that piperine was present in three of seven analysed products in the turmeric liver-injury series, whose authors specifically raised increased combination with black pepper as a possible driver of the rise in cases (Halegoua-DeMarzio et al., 2023). The claim that black pepper meaningfully raises energy expenditure in humans is unsupported; no meta-analysis establishes it. Pepper is a superb flavour tool, a legitimate salt-reduction aid, and Kerala's historical fortune. It is not a metabolic intervention.
Kudampuli: one plant, two verdicts, and the rule you can take everywhere
The best teaching case in this book is a fruit rind sitting in a Kottayam fish curry.
Kudampuli is Garcinia gummi-gutta, Malabar tamarind, the sour dried rind that gives meen vevichathu its back-of-the-throat acidity. It is also, as Garcinia cambogia, the source of one of the most heavily marketed weight-loss supplements on earth. Same species, entirely different sentences.
The supplement first. Concentrated hydroxycitric acid extract, reviewed across 23 identified randomised trials of which nine were pooled, produced a mean difference in weight loss of −0.88 kg (95% CI −1.75 to −0.00); the authors' own verdict was that the magnitude is small and the clinical relevance uncertain (Onakpoya et al., 2011). Note the interval: the upper bound touches zero. Then the safety side. LiverTox assigns Garcinia cambogia a likelihood score of B, a likely rare cause of clinically apparent liver injury, probably fewer than one in 10,000 users; at least a dozen published cases exist, onset typically one to four weeks after starting, severity ranging from enzyme elevations to acute liver failure requiring transplantation, with some fatal cases. So the supplement offers, at best, under a kilogram of weight loss in exchange for a rare risk of losing your liver.
And the culinary rind? LiverTox is explicit that the dried fruit rind's traditional use as a food preservative and flavouring in curries is not linked to the reported liver-injury cases, which involve concentrated supplements. One to three grams of rind, soaked and simmered in a curry that feeds four, is not the exposure. Cook with the fruit; do not take the capsules. Get this right in both directions, because there is an equal and opposite error going around: readers who have heard that Garcinia is hepatotoxic and have started leaving kudampuli out of their fish curry. That costs them the best souring agent in the repertoire along with a genuine glycaemic advantage, since pooled trials of acid with meals show reductions in glucose area under the curve (standardised mean difference −0.60, 95% CI −1.08 to −0.11) and insulin area under the curve (−1.30, −1.98 to −0.62) (Shishehbor et al., 2017).
The transferable rule will settle nine out of ten food claims you meet from here on. When a plant is sold as a supplement, ask four questions: what dose, what extract, what concentration, and what evidence at that dose. Same species does not mean same substance. A whole food used in grams as a flavouring, inside a mixed meal, absorbed slowly alongside fibre and fat, is a different pharmacological exposure from a standardised extract of one isolated compound taken on an empty stomach at twenty times the concentration, daily, for months. That is why culinary turmeric is safe while turmeric-plus-piperine capsules have killed someone; why fenugreek in your fish curry does nothing while 20 g of soaked seed matters to your insulin dose; why cinnamon at trial doses breaches a regulatory limit that cinnamon on a payasam does not approach. Dose, extraction, concentration. Every time.
What spices are actually for in this book
Strip the claims away and something considerable remains, though it is not what the supplement aisle sells.
The strongest evidence in this book is about patterns and quantities: a dietary pattern that lowered blood pressure by 11.4/5.5 mmHg in people with hypertension without changing salt or body weight, a low-glycaemic staple that shifts HbA1c by 0.3 to 0.5 percentage points, a salt swap that cut stroke and total mortality, oil measured with a spoon instead of poured, a pulse on every plate. Every one of those asks the reader to eat food that is less salty, less oily and less sweet than the food they are used to, and the whole enterprise fails at precisely the point where that food stops being worth eating. Adherence, not composition, is what separated the arms in the best dietary trials.
That is where spices earn their place. Flavour density is what makes low-salt, low-oil food something a person is still cooking a year later. Mustard seeds popped in properly hot oil, curry leaves fried until they crackle, whole spices dry-roasted before grinding, shallots browned slowly for body, pepper ground fresh over a finished dish, a scrape of nutmeg, cardamom crushed in the shell, chilli lifting a dish that carries a third less salt than it used to, and kudampuli, tamarind, lime and raw mango giving an acidity that makes the tongue read a dish as fully seasoned when it is not. Aroma, pungency and acid do the work salt and fat used to do.
That is a real metabolic contribution, and it is measurable, just not in the units the labels use. It shows up as sodium you did not eat, oil you did not pour, and a plate you are still making next spring. Spices are not medicine. They are the reason the medicine of the plate goes down.